X-ray Diffraction (XRD): Principles, Instrumentation and Data Interpretation
X-ray Diffraction (XRD)
MATERIALS CHARACTERIZATION · TOPIC 01.01 · CRYSTAL STRUCTURE
X-ray diffraction is used to investigate long-range atomic order in crystalline materials. In a conventional powder experiment, the instrument records diffracted intensity as a function of scattering angle. The positions, intensities, widths and shapes of diffraction peaks contain different information; they must not be interpreted as interchangeable indicators.
The central distinction: the detector measures photon counts. Interplanar spacings, phases, lattice parameters, crystallite sizes and structural models are inferred from those counts using diffraction physics and a model of the instrument.
1. What happens during an XRD experiment?
A typical laboratory powder diffractometer follows this sequence:
- An X-ray source generates photons with a spectrum determined by the target material, tube voltage/current and source design.
- Incident-beam optics condition the beam by controlling divergence, footprint, wavelength components and unwanted radiation.
- The beam interacts with the specimen. Periodic electron density in the crystal produces coherent scattering.
- At specific geometries, waves scattered by families of lattice planes interfere constructively.
- Receiving optics define which scattered photons reach the detector.
- The detector converts incident X-ray photons into electrical pulses or another measurable signal.
- The instrument records counts against the detector angle, commonly reported as (2), to produce a diffraction pattern.
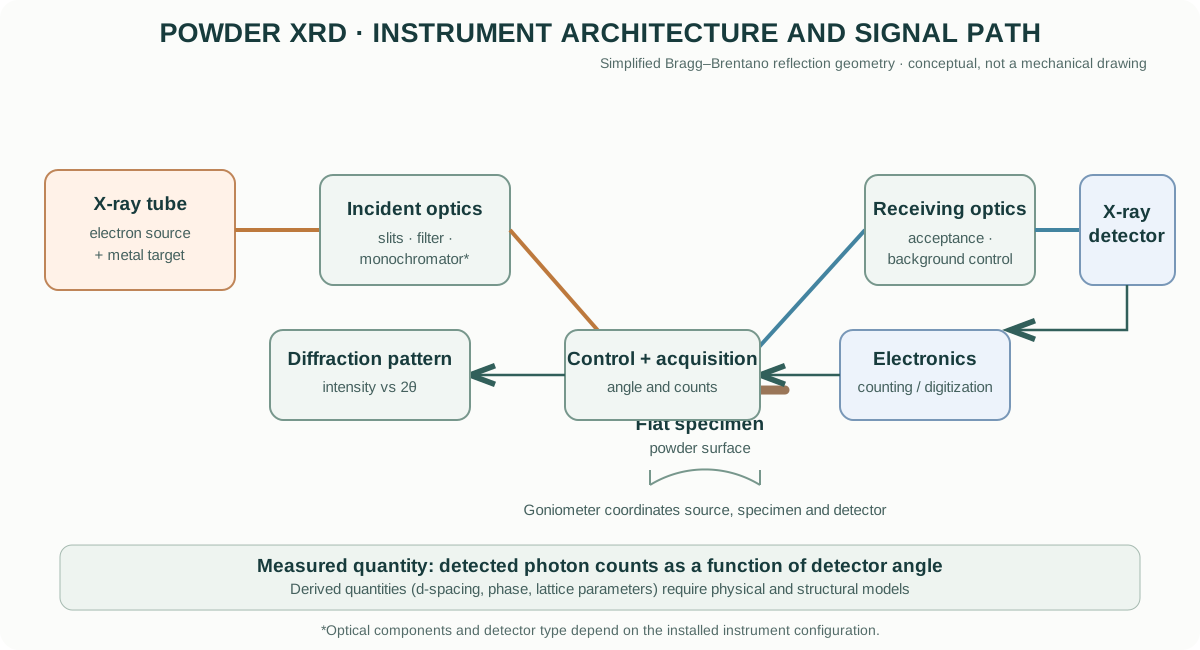
The exact arrangement depends on the instrument and measurement geometry. A Bragg–Brentano θ–2θ instrument is common for flat-plate powders, but capillary transmission, parallel-beam, grazing-incidence and single-crystal geometries are different configurations.
2. Where do laboratory X-rays come from?
A conventional sealed X-ray tube contains an electron source (cathode) and a metal target (anode). A high potential accelerates electrons toward the target. Their deceleration produces a continuous bremsstrahlung spectrum, while electronic transitions in target atoms produce characteristic X-ray lines.
For a copper target, the characteristic Cu K radiation is widely used in laboratory powder diffraction. Other anode materials are selected for particular applications, fluorescence behaviour, absorption edges or wavelength requirements.
The spectrum is not automatically monochromatic. The Kα emission itself can contain closely spaced components, and unwanted wavelengths or continuum radiation may need to be suppressed by filters, monochromators or suitable optics. Modern detectors and monochromating arrangements handle these components in different ways.
Do not assume every diffractometer uses Cu Kα radiation. Check the actual anode/target, wavelength configuration and optics recorded for the measurement.
3. Why does a crystal diffract X-rays?
X-rays interact primarily with the electron density in a material. Each atom scatters incident radiation, and the periodic arrangement of atoms causes scattered waves to interfere. Most directions give partial cancellation; specific directions satisfy a constructive-interference condition.
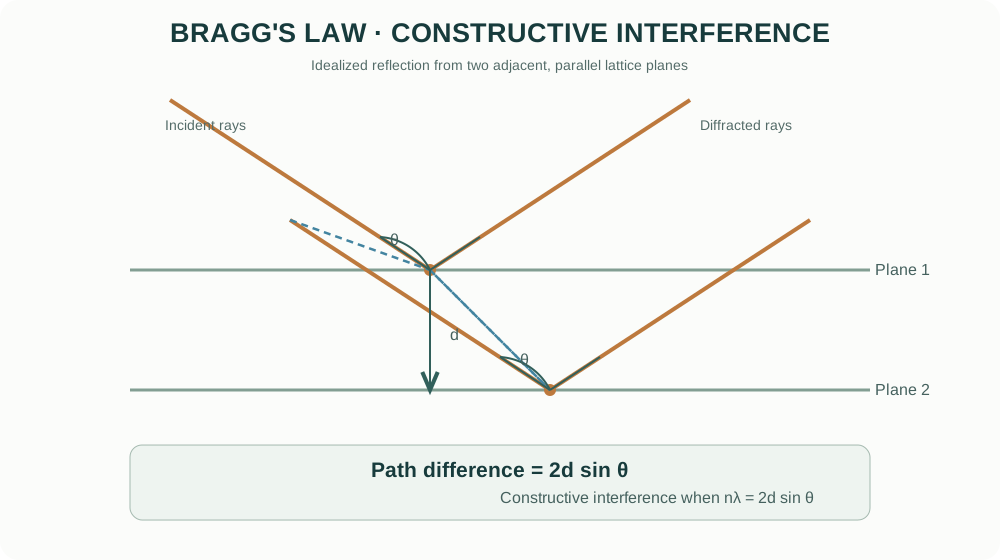
For parallel lattice planes separated by distance (d_{hkl}), the extra path travelled by rays reflected from successive planes is (2d_{hkl}). Constructive interference occurs when this path difference is an integer number of wavelengths:
[ n= 2d_{hkl} ]
This is Bragg’s law, where:
- is the diffraction order (usually absorbed into the plane indices in routine powder analysis);
- () is the X-ray wavelength;
- (d_{hkl}) is the spacing of planes with Miller indices (hkl);
- () is the Bragg angle, half the scattering angle reported as (2).
A useful numerical example
For Cu Kα radiation with (,), consider a reflection at (2^). Then (^). For first-order diffraction:
[ d= = , ]
This is an interplanar spacing inferred from the peak position; it is not automatically a particle diameter or a direct measurement of a unit-cell edge.
4. Why a powder produces many peaks
A powder contains a very large number of crystallites with different orientations. For each set of lattice planes, some crystallites are oriented so that the diffraction condition is met. In a conventional θ–2θ scan, the diffracted intensity appears at the corresponding detector angle.
For a cubic crystal:
[ d_{hkl}= ]
Combining this expression with Bragg’s law gives a relationship between peak positions and the lattice parameter (a). For non-cubic systems, the spacing equation depends on the crystal system and lattice metrics.
Peak positions therefore provide information about lattice spacings and unit-cell dimensions. A systematic shift may arise from a genuine lattice change, but also from specimen displacement, zero error, wavelength configuration or sample transparency.
5. The main parts of a laboratory powder diffractometer
X-ray source and generator
The tube target determines characteristic wavelengths. Generator voltage and current influence the electron energy and photon flux. Tube power, cooling, ageing and alignment affect operation and stability. Follow the model-specific limits and interlock procedures.
Incident-beam optics
Depending on the instrument, these may include divergence slits, Soller slits, anti-scatter slits, filters, monochromators, mirrors or variable divergence optics. They control beam divergence, axial divergence, spectral purity and illuminated footprint.
A narrow divergence condition can improve angular definition but reduce intensity. Optics must be selected with the specimen size, geometry and resolution requirement in mind.
Goniometer and specimen stage
The goniometer controls angular relationships among source, specimen and detector. In Bragg–Brentano reflection geometry, the incident and receiving angles are coupled during a conventional θ–2θ scan. The specimen surface must be positioned at the correct diffractometer reference height.
Receiving optics and detector
Receiving slits, analyser crystals, monochromators or detector-side optics define angular acceptance and background rejection. Detectors may be scintillation counters, proportional counters, solid-state detectors or position-sensitive / one-dimensional detector systems. Their count-rate capability, energy discrimination, active area and geometry influence the pattern.
Enclosure, alignment and standards
Shielding and interlocks protect the operator from X-ray exposure. Alignment standards and reference materials are used to check angular calibration, instrument profile and geometry. A reference scan is not optional when accurate peak positions or profile parameters are important.
6. Bragg–Brentano geometry versus other geometries
In conventional Bragg–Brentano reflection geometry, the incident beam illuminates a flat specimen and the detector moves in a coupled angular relationship. The geometry is convenient for bulk powders and many polycrystalline solids.
Other arrangements answer different experimental needs:
- Parallel-beam reflection: less sensitive to some specimen-height and surface-shape effects; useful for rough, curved or non-flat specimens and thin films, depending on optics.
- Capillary transmission: the beam passes through a rotating capillary; useful for powders where transmission geometry and reduced preferred orientation are advantageous.
- Grazing-incidence XRD (GI-XRD): uses a small fixed incident angle to enhance sensitivity to near-surface layers and thin films.
- Single-crystal diffraction: uses a different strategy to measure reciprocal-space reflections and determine detailed crystal structures.
Do not transfer scan settings, correction assumptions or intensity interpretation from one geometry to another without checking the geometry.
7. How to read a diffraction pattern
A powder pattern is commonly plotted as intensity (counts or counts per second) versus (2).
| Pattern feature | What it can tell you | What it cannot establish alone |
|---|---|---|
| Peak position | Interplanar spacing; lattice parameters when indexed | A unique phase identity from one peak |
| Relative peak intensity | Structure factor and orientation-dependent intensity | Phase fraction without a suitable quantitative model |
| Peak width / shape | Instrument profile, domain size, strain, defects and overlap | Particle size directly |
| Background | Air scatter, fluorescence, amorphous scattering, holder and instrument contributions | Amorphous fraction without a justified model |
| Extra reflections | Possible secondary phase, impurity or artefact | A phase assignment without checking the full pattern |
Phase identification
A candidate phase should explain the complete set of observed reflections, not merely one or two strong peaks. Check:
- whether all major observed peaks are accounted for;
- whether expected strong peaks are absent;
- whether candidate phases overlap at key positions;
- whether the wavelength and scan geometry match the reference pattern;
- whether the sample chemistry and processing history make the proposed phase plausible.
Database matching is a starting point, not a substitute for crystallographic reasoning.
Indexing and lattice parameters
Indexing assigns Miller indices to reflections under a proposed unit cell and symmetry. The resulting lattice parameters should be refined using multiple reflections and appropriate corrections. Systematic residuals versus angle may indicate specimen displacement, zero shift, wavelength/profile issues or an incorrect structural model.
8. Peak broadening: crystallite size, strain and instrument response
A measured peak is not infinitely narrow. Broadening can arise from:
- finite coherent diffraction-domain size;
- microstrain and distributions of lattice spacings;
- defects, stacking faults and compositional inhomogeneity;
- instrumental resolution and spectral contributions;
- unresolved overlapping reflections.
The Scherrer equation gives an approximate coherent-domain size:
[ D= ]
where (K) is a shape factor, () is the wavelength, () is the specimen-related breadth in radians (commonly the integral breadth or a defined FWHM approximation), and () is the Bragg angle.
Instrumental broadening must be assessed. A standard with negligible specimen broadening under comparable conditions can be used to characterize the instrument profile. Simple subtraction such as (=) is only appropriate under particular profile assumptions (for example, Gaussian contributions). Lorentzian and Voigt profiles require different treatment.
The Scherrer estimate is a coherent diffraction-domain size. It is not necessarily the particle size seen by SEM, the agglomerate size, or the grain size in a sintered ceramic.
Microstrain
A distribution of lattice spacings broadens reflections. Size and strain contributions can sometimes be explored with Williamson–Hall-type analysis, but such plots rely on assumptions about profile shape, isotropy and the separation of broadening contributions. They should not be treated as definitive when the data quality or specimen physics does not support those assumptions.
9. Practical measurement workflow
Before loading the specimen
- Define the scientific question: phase identification, lattice parameter, texture, crystallite-size estimate, thin-film response or quantitative phase analysis.
- Confirm the instrument geometry, anode/target, wavelength, optics, detector and sample-holder compatibility.
- Check instrument status, cooling, enclosure, interlocks and local radiation-safety procedure.
- Select a reference standard if accurate peak positions or instrumental broadening are required.
Specimen preparation
- Prepare a representative powder with minimal contamination and avoid unnecessary aggressive grinding that could introduce strain or phase changes.
- Fill the holder uniformly and produce a flat surface at the correct reference height.
- Avoid excessive compaction that creates strong preferred orientation.
- Use a rotating specimen stage when appropriate to improve particle statistics.
- For air-sensitive or moisture-sensitive materials, use a suitable sealed holder or controlled atmosphere compatible with the instrument.
Choosing scan conditions
- 2θ range: cover the reflections needed to distinguish the candidate phases and refine the required parameters.
- Step size / detector sampling: ensure adequate sampling of the narrowest peaks relevant to the analysis.
- Counting time: increase it when weak peaks, minor phases or low sample mass require better counting statistics.
- Optics: choose resolution and intensity based on the analysis goal; do not assume the narrowest slit setting is always best.
- Specimen rotation: consider it for coarse powders or preferred-orientation concerns, while recognizing that it does not remove all texture effects.
For phase screening, a relatively broad and efficient scan may be adequate. For lattice refinement, profile analysis or minor-phase detection, use conditions validated for that specific task.
During and after acquisition
Inspect the raw pattern before background subtraction or fitting. Look for abnormal background, detector saturation, spikes, peak asymmetry, holder peaks, fluorescence and specimen-height errors. Save raw data and record the complete acquisition configuration.
10. Common artefacts and how to diagnose them
| Source | Typical effect | Diagnostic / control |
|---|---|---|
| Specimen displacement | Systematic peak-position shift, often angle-dependent | Repack at correct height; measure a standard; refine a justified displacement term |
| Zero shift / goniometer error | Peak-position offset | Verify angular calibration with a reference standard |
| Preferred orientation | Relative intensities differ from random-powder expectation | Improve powder preparation; rotate specimen; consider texture-aware modelling |
| Fluorescence | Elevated background and poor signal-to-background | Choose a suitable anode, energy-discriminating detector or optics |
| Coarse particles / poor statistics | Irregular intensities and poor reproducibility | Improve particle statistics and specimen rotation |
| Surface roughness / transparency | Peak shifts, asymmetry or intensity distortion | Prepare suitable specimen surface; consider geometry-specific corrections |
| Axial divergence / optics | Asymmetric peak shapes, especially at low angles | Use a suitable optical configuration and instrument profile |
| Sample absorption / microabsorption | Distorted relative intensities in mixtures | Consider composition, particle size and validated quantitative methods |
| Kα doublet / spectral components | Apparent peak splitting or asymmetric profiles | Model or suppress spectral components using the actual optics |
| Holder contribution | Extra reflections or background | Run an empty-holder scan and select a low-background holder |
11. Rietveld refinement: what the software is doing
Rietveld refinement fits a calculated diffraction profile to the entire observed pattern by adjusting parameters in a crystallographic and instrumental model. The calculated profile depends on the crystal structure, phase scale factors, unit-cell parameters, peak-shape/profile functions, preferred orientation, background and other justified terms.
A disciplined sequence is:
- Import the raw pattern and verify radiation, wavelength, geometry and instrument configuration.
- Establish a plausible background model without absorbing real broad peaks.
- Add candidate phases supported by chemistry and observed reflections.
- Refine scale factors and a small number of stable profile parameters.
- Address zero shift or specimen displacement using standards or a justified model.
- Refine lattice parameters and other structural parameters only when data quality supports them.
- Consider preferred orientation, anisotropic broadening or microstrain only when residual features and specimen physics justify them.
- Inspect the observed, calculated and difference profiles across the entire pattern.
- Examine parameter uncertainties, correlations, constraints and chemical plausibility.
A low (R_{wp}) or visually smooth fit does not prove that the phase model is correct. Over-parameterization can reduce residuals while producing physically meaningless parameters.
GSAS-II and other software
GSAS-II is a general crystallographic package used for diffraction data reduction and Rietveld analysis. Other commonly used packages include TOPAS and FullProf. PDXL is Rigaku’s analysis environment. Software-specific workflows differ, but the physical assumptions and need to inspect the model remain the same.
12. Quantitative phase analysis: important cautions
Rietveld scale factors can be used to estimate crystalline phase fractions when the structural models, data collection and refinement are appropriate. Results can be biased by:
- unmodelled amorphous or poorly crystalline material;
- preferred orientation and microabsorption;
- inadequate particle statistics;
- incorrect structural models or occupancies;
- overlapping peaks and insufficient counting statistics;
- unsuitable background or profile functions.
An internal standard can help estimate amorphous content under a validated protocol. Do not report a precise phase fraction simply because refinement software outputs one.
13. Bruker D8 DISCOVER as an instrument example
The Bruker D8 DISCOVER is a configurable X-ray diffraction platform. Depending on its installed configuration, a system may use different sources, beam-conditioning optics, sample stages, detectors and measurement geometries. The model name alone does not identify the exact optical path or detector fitted to a particular laboratory instrument.
For a D8 DISCOVER measurement, record the actual installed anode, generator settings, incident and receiving optics, detector model, stage, geometry and software configuration. Use the instrument-specific configuration and current operating documentation rather than assuming that another D8 DISCOVER installation is identical.
14. Manufacturer resources
The following links point to manufacturer-owned product information. They are provided for model identification and access to current technical documentation, not as endorsements.
- Bruker — D8 DISCOVER X-ray diffractometer
- Malvern Panalytical — Empyrean X-ray diffractometer
- Rigaku — SmartLab X-ray diffractometer
Compare the source/anode, geometry, detector, optical configuration, sample stages, angular range, resolution, automation and supported analysis workflow. Always consult the datasheet and manual for the exact installed model and options.
15. Reporting checklist
A reproducible XRD methods section should identify:
- instrument manufacturer and model;
- X-ray source / anode and wavelength;
- generator settings where relevant;
- scan geometry and optics;
- detector type;
- specimen preparation, holder and rotation conditions;
- 2θ range, step size or detector sampling, and counting time;
- reference standard and calibration procedure where used;
- software and version;
- phase models, refinement constraints and corrections;
- uncertainty and limitations of derived quantities.
16. Intellectual-property and educational scope
The explanatory text and diagrams in this guide are original educational material. The diagrams are generalized conceptual illustrations, not copies of manufacturer schematics. Manufacturer names and links identify their respective products. Trademarks, product photographs, manuals, datasheets and proprietary drawings remain the property of their owners. Consult the official documentation for model-specific operation, maintenance and safety limits.
This guide explains general diffraction principles. It does not replace instrument-specific training, radiation-safety procedures, calibration standards or the current operating manual.