X-ray Photoelectron Spectroscopy (XPS)
X-ray Photoelectron Spectroscopy (XPS)
MATERIALS CHARACTERIZATION · TOPIC 01.04 · SURFACE CHEMISTRY
X-ray photoelectron spectroscopy (XPS) is a surface-sensitive technique used to identify elements and investigate their chemical states in the near-surface region of a solid. It measures the kinetic energies and intensities of photoelectrons emitted when the specimen is irradiated with X-rays.
XPS is particularly useful for oxide ceramics, catalysts, thin films, corrosion layers and functional materials where surface composition or oxidation state may differ from the bulk.
The central distinction: XPS measures electron kinetic energy and intensity. Binding energies, elemental concentrations and chemical-state assignments are obtained through calibration, spectral processing and interpretation.
1. The photoelectric effect: the physical basis
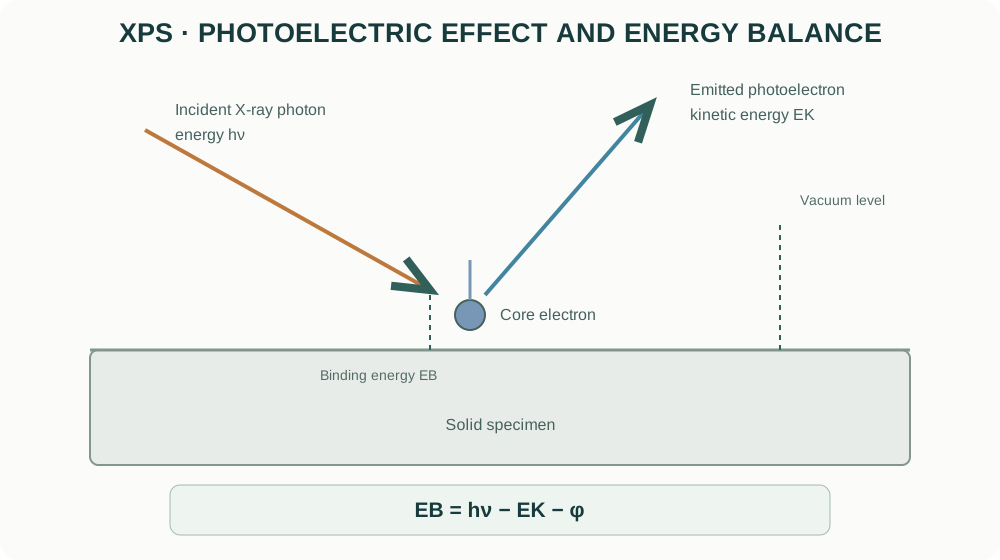
An incident X-ray photon transfers its energy to a bound electron. If the electron receives enough energy to overcome its binding energy and escape the solid, it can be detected as a photoelectron.
The energy relationship is:
[ E_B=h-E_K- ]
where:
- (E_B) is the electron binding energy;
- (h) is the incident photon energy;
- (E_K) is the measured photoelectron kinetic energy;
- () is the spectrometer work-function term under the adopted convention.
The spectrometer measures kinetic energy; the software converts it to binding energy using the photon energy and instrument calibration. Different elements and electronic levels produce characteristic binding-energy features.
2. Why XPS is surface-sensitive
Photoelectrons lose energy through inelastic scattering as they travel through a solid. Electrons that undergo significant energy loss contribute to the inelastic background rather than the sharp characteristic peaks used for chemical analysis.
Only electrons generated within a limited escape depth can leave the specimen without substantial energy loss. The information depth is commonly a few nanometres, but it depends on electron kinetic energy, material, emission angle and instrument geometry.
A simplified relationship for attenuation is:
[ I(z)=I_0(-) ]
where (z) is depth normal to the surface, () is an effective inelastic mean free path, and () is the emission angle measured from the surface normal in this convention. Different conventions define the angle differently; state the geometry when using this expression.
XPS is therefore not a bulk-average composition technique. Surface contamination, adsorbed water, hydroxylation, segregation and oxidation can make the near-surface chemistry different from the bulk measured by XRD or bulk chemical analysis.
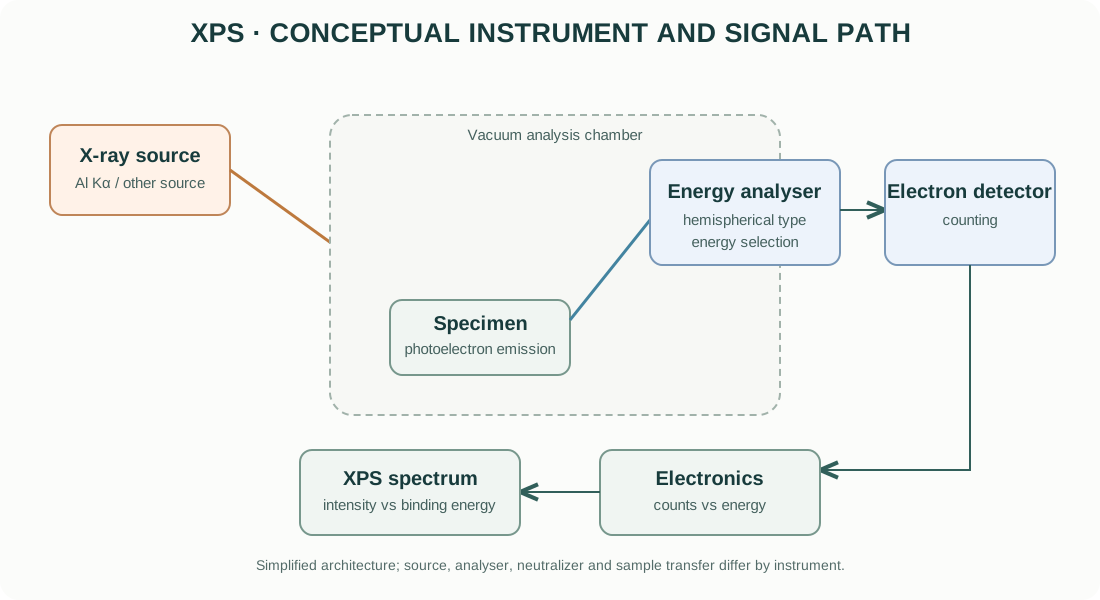
3. Main components of an XPS instrument
X-ray source
Laboratory XPS instruments commonly use characteristic X-ray sources such as Al Kα. Some systems use monochromated sources to reduce satellite features and improve spectral quality. Other photon sources and beam configurations are available in specialized instruments.
The photon energy determines which core levels can be excited and influences the kinetic energy and sampling depth of the emitted electrons.
Ultra-high-vacuum (UHV) system
The specimen and electron analyser operate under high or ultra-high vacuum to reduce collisions of photoelectrons with gas molecules and to limit surface contamination. Vacuum requirements and sample compatibility depend on the instrument.
Volatile, wet or outgassing specimens may not be suitable for direct introduction without specialized preparation or transfer.
Electron energy analyser
A hemispherical analyser is widely used. Electrostatic fields select electrons within a kinetic-energy window and direct them toward the detector. The pass energy and entrance slit influence energy resolution and count rate.
Lower pass energy generally improves energy resolution but reduces signal intensity. Higher pass energy increases throughput but broadens spectral features. Acquisition settings should match the chemical-state question.
Detector and electronics
The detector converts arriving electrons into electrical pulses. The system records counts against kinetic or binding energy. The measured spectrum is affected by analyser transmission, detector efficiency, acquisition time and background.
Charge neutralization
Insulating specimens can accumulate positive charge as photoelectrons leave the surface. Electron flood guns, low-energy ion neutralizers or other charge-control arrangements may be used, depending on the instrument. Neutralization settings must be optimized and documented.
4. Survey scans and high-resolution scans
Survey spectrum
A survey scan covers a broad binding-energy range at relatively coarse energy resolution. It is used to identify the elements present above the instrument’s detection capability and to locate core-level regions for detailed scans.
Survey spectra help identify unexpected elements from contamination, sample holders, mounting media or preparation steps.
High-resolution spectrum
A high-resolution scan covers a narrower binding-energy window around a selected core level. It provides the detail needed to investigate chemical shifts, spin-orbit splitting, multiplet structure and overlapping components.
Do not infer oxidation states from a survey spectrum alone. Chemical-state analysis requires adequate energy resolution, signal-to-noise ratio, calibration and physically defensible peak models.
5. Reading an XPS spectrum
An XPS spectrum is commonly plotted as counts per second versus binding energy. Many instruments display binding energy decreasing from left to right, but plotting convention should always be checked.
| Feature | Interpretation |
|---|---|
| Peak position | Elemental core level and chemical environment |
| Peak area | Signal intensity related to abundance and sensitivity factors |
| Peak width | Instrument resolution, chemical heterogeneity, lifetime broadening and fitting model |
| Spin-orbit doublet | Splitting of core levels with non-zero orbital angular momentum |
| Satellite / shake-up feature | Additional energy-loss or many-electron processes |
| Inelastic background | Electrons that have lost energy before detection |
| Charging shift | Apparent energy displacement caused by surface potential |
Peak position is not a unique fingerprint of oxidation state. Chemical shifts can be small and are affected by bonding, screening, coordination, final-state effects and charging.
6. Chemical-state analysis and peak fitting
Chemical-state analysis often involves fitting high-resolution core-level spectra with physically constrained components. A defensible fit should reflect known spectral structure rather than simply minimize residuals.
A disciplined fitting sequence
- Verify the energy scale and calibration.
- Inspect the raw spectrum and signal-to-noise ratio.
- Select a justified background model (for example, Shirley or Tougaard, depending on the physical context).
- Identify expected spin-orbit splitting, branching ratios and multiplet structure.
- Select line shapes appropriate to the material and instrument resolution.
- Apply physically justified constraints to doublet separation, area ratio and widths.
- Fit the minimum number of components that explain the data.
- Inspect residuals and parameter correlations.
- Compare with reference data and independent chemical evidence.
Background models
The Shirley background is commonly used for many core-level spectra, while Tougaard-type backgrounds can be useful when inelastic energy-loss contributions are important. Neither is universally correct. The background choice can substantially affect fitted component areas, especially for weak or overlapping peaks.
Line shapes
Gaussian and Lorentzian contributions are often combined in Voigt or pseudo-Voigt-type line shapes. Instrumental broadening, lifetime broadening and sample heterogeneity all contribute to observed widths.
Avoid assigning a large number of chemical states solely to improve the residual. Overfitting can create apparently precise but chemically meaningless components.
7. Spin-orbit splitting and multiplet structure
Many core levels split into two components due to spin-orbit coupling. The separation and relative areas are characteristic of the electronic level and should be constrained according to accepted physical values and the chemical system.
Transition-metal oxides can exhibit multiplet splitting, satellites and complex final-state effects. A simple two-peak fit may be inadequate for some transition-metal spectra.
For transition-metal oxides, use literature and reference spectra for the same core level and chemical family, and avoid interpreting every shoulder as a distinct oxidation state without a suitable model.
8. Quantification: atomic concentration
XPS quantification commonly uses integrated peak areas corrected by relative sensitivity factors (RSFs). A simplified expression for the atomic fraction of element (i) is:
[ C_i= ]
where (A_i) is the background-subtracted peak area and (S_i) is the applicable sensitivity factor. Instrument transmission and the selected quantification protocol may also be included.
Reported XPS atomic percentages are generally normalized over the elements included in the analysis. Hydrogen and helium are not detected by conventional XPS. Carbon contamination is often present and may be included or excluded depending on the reporting question.
Quantification is affected by:
- surface roughness and morphology;
- sample heterogeneity;
- overlapping peaks;
- attenuation by contamination layers;
- sensitivity-factor calibration;
- analyser transmission and geometry;
- peak fitting and background choice.
Do not interpret XPS atomic percent as bulk stoichiometry without independent evidence.
9. Charge correction and energy calibration
Insulating oxides and ceramics can charge under X-ray irradiation. Differential charging can broaden or split peaks and cause different regions to shift by different amounts.
A common practice is to reference adventitious carbon C 1s, but the assumed binding energy is not universal and can be unreliable for some surfaces. Conductive references, instrument standards and internal spectral features may provide alternatives depending on the sample and instrument.
Report the charge correction method and reference value. Do not silently shift spectra until they match an expected oxidation-state assignment.
10. Depth profiling and angle-resolved XPS
Angle-resolved XPS (ARXPS)
Changing the electron emission angle changes the effective sampling depth. More surface-sensitive conditions can emphasize the outermost region without sputtering. Interpretation requires a suitable model for surface roughness, morphology and attenuation.
Sputter depth profiling
Ion sputtering can remove material incrementally and record spectra at successive stages. However, sputtering may:
- preferentially remove one element;
- reduce transition-metal oxides;
- mix interfaces;
- roughen the surface;
- implant sputter-gas ions;
- alter chemical states.
For oxides, ion bombardment can reduce metal cations and create oxygen vacancies. A sputtered spectrum may therefore represent a modified surface rather than the original material.
Use sputtering only when the scientific question justifies it, and document ion species, energy, incidence angle, current density and sputter time or calibrated depth.
11. Practical specimen preparation
- Use clean, dry specimens compatible with the instrument’s vacuum system.
- Minimize handling and organic contamination.
- Mount the sample securely with good electrical contact where possible.
- Avoid adhesives or tapes in the analysis region unless their contribution is understood.
- For powders, ensure that particles are immobilized and do not contaminate the chamber.
- For air-sensitive samples, consider inert transfer or a suitable sealed transfer system.
- Record any polishing, cleaning, annealing, sputtering or coating performed before analysis.
Do not sputter-clean a specimen automatically. Cleaning may remove the surface chemistry that the experiment is intended to measure.
12. Common XPS artefacts and interpretation risks
| Problem | Effect | Diagnostic / control |
|---|---|---|
| Uniform charging | Overall binding-energy shift | Verify charge compensation and reference method |
| Differential charging | Broadening, asymmetry or apparent multiple states | Improve grounding/neutralization; inspect multiple regions |
| Adventitious carbon | C 1s signal and possible energy reference | Minimize exposure; state referencing protocol |
| Surface oxidation | Surface composition differs from bulk | Compare with bulk-sensitive methods and controlled transfer |
| Sputter reduction | Artificially lower oxidation states | Compare unsputtered and sputtered spectra |
| Overfitting | Too many chemical components | Use physical constraints and independent evidence |
| Incorrect background | Biased peak areas and chemical components | Compare justified background models |
| Peak overlap | Ambiguous element or state assignment | Use other core levels and reference spectra |
| X-ray damage | Time-dependent chemistry or signal changes | Repeat scans at different exposure times |
13. XPS compared with complementary techniques
| Technique | Main information | Sampling character |
|---|---|---|
| XPS | Surface elemental composition and chemical states | Near-surface, typically nanometre-scale information depth |
| EDS | Local elemental composition | Interaction volume commonly much deeper than XPS |
| XRD | Long-range crystalline structure and phases | Bulk-weighted for conventional powder geometries |
| AES | Surface elemental analysis with high lateral resolution in suitable systems | Very surface-sensitive |
| UPS | Valence electronic structure and work function | Surface-sensitive occupied electronic states |
These techniques are complementary. Agreement between XPS and EDS is not guaranteed because their sampling depths, sensitivities and quantification models differ.
14. Manufacturer resources
Official manufacturer resources for XPS systems:
- Thermo Fisher Scientific — X-ray Photoelectron Spectroscopy
- Kratos Analytical — XPS systems
- ULVAC-PHI — Surface analysis
- Scienta Omicron — Surface science
Compare X-ray source, monochromation, analyser type, energy resolution, sample handling, charge neutralization, mapping capability, vacuum transfer and sputtering options. Confirm the actual instrument configuration before comparing specifications.
15. Reporting checklist
A reproducible XPS methods section should report:
- instrument manufacturer and model;
- X-ray source and photon energy;
- analyser type and pass energy;
- spot size and analysis area;
- vacuum conditions where relevant;
- survey and high-resolution scan ranges and step sizes;
- charge-neutralization method;
- binding-energy calibration or referencing procedure;
- background and line-shape models;
- fitting constraints and sensitivity factors;
- whether spectra were sputter-cleaned or depth-profiled;
- quantification basis and limitations.
16. Intellectual-property and educational scope
The explanatory text and figures in this guide are original educational material. The diagrams are conceptual and are not copied from manufacturer manuals or proprietary schematics. Manufacturer names and links identify their respective products. Product photographs, manuals, proprietary drawings and trademarks remain the property of their owners.
This guide explains general XPS principles. It does not replace instrument-specific training, UHV and X-ray safety procedures, sample-compatibility review or the current operating manual.