UV–Vis Diffuse Reflectance Spectroscopy (DRS)
UV–Vis Diffuse Reflectance Spectroscopy (DRS)
MATERIALS CHARACTERIZATION · TOPIC 01.03 · OPTICAL RESPONSE
UV–Vis diffuse reflectance spectroscopy is widely used to study the optical response of powders, ceramics, coatings and other strongly scattering materials. It measures reflected light as a function of wavelength. Absorption-related quantities such as an optical band-gap estimate are inferred through a model; they are not measured directly by the detector.
The key distinction is between measured reflectance, a transformed reflectance function, and a band-gap estimate obtained from a chosen optical-transition model. These quantities should not be treated as interchangeable.
1. What does a UV–Vis spectrophotometer measure?
A spectrophotometer selects light over a wavelength range, sends it to the specimen and measures the intensity reaching a detector. In diffuse reflectance mode, an integrating sphere collects light scattered from the sample over a wide range of directions.
The instrument typically compares the specimen signal with a reference standard and reports reflectance as a function of wavelength. The exact optical layout depends on the instrument: double-beam and single-beam arrangements, monochromators, detectors and sphere geometries vary.
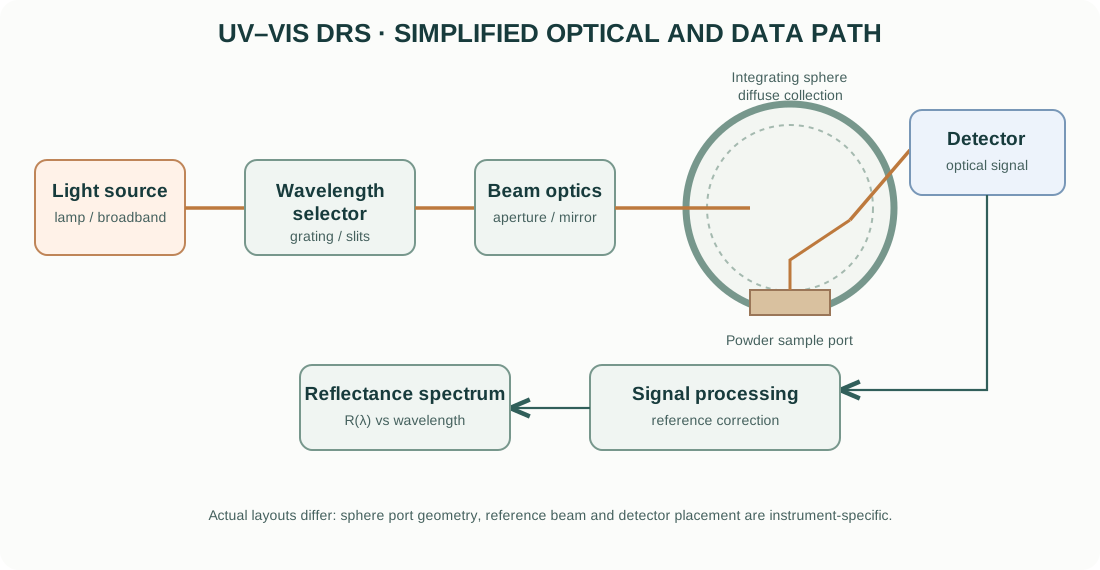
A simplified measurement sequence is:
- A lamp or other source provides broadband optical radiation.
- A monochromator or wavelength-selection system isolates a narrow wavelength band.
- Beam optics direct the selected light toward the sample.
- The sample absorbs and scatters incident photons.
- An integrating sphere collects a defined portion of diffusely reflected light.
- A detector converts the collected optical power into an electrical signal.
- Reference comparison and instrument processing produce a reflectance spectrum.
2. Light sources, wavelength selection and detectors
Light sources
UV–Vis instruments may use deuterium lamps for ultraviolet wavelengths and tungsten-halogen lamps for visible and near-infrared regions. Xenon sources and other architectures are used in some instruments. The actual lamp combination and wavelength range depend on the model.
Monochromator
A grating-based monochromator separates wavelengths. Entrance and exit slits determine spectral bandwidth and optical throughput. Narrower bandwidth can improve spectral resolution but reduces optical power at the sample.
Some instruments use diode-array detection rather than scanning a monochromator across the spectrum. In that arrangement, a dispersed range of wavelengths can be detected simultaneously.
Detectors
Photomultiplier tubes, silicon photodiodes and other detector technologies cover different spectral regions and signal levels. Detector response, dark signal, linearity and wavelength-dependent sensitivity affect the measured spectrum.
3. Why an integrating sphere is used
A diffuse specimen scatters incident light in many directions. A conventional detector placed at one angle would collect only a fraction of the reflected light and could produce a result strongly dependent on sample orientation and surface texture.
An integrating sphere is a hollow sphere with a highly reflective internal coating. Light entering the sphere undergoes multiple reflections and becomes more spatially distributed. A detector measures the resulting sphere signal through a port.
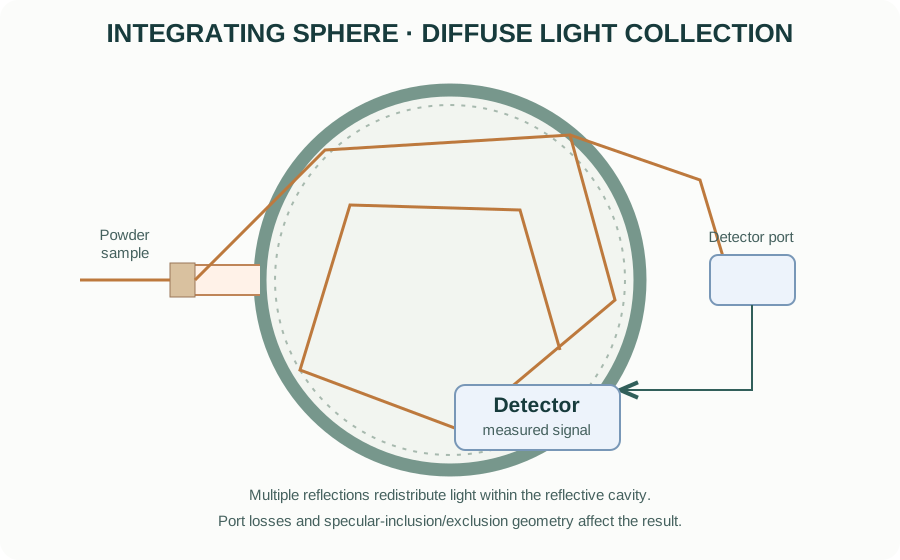
The sphere does not collect every photon under every configuration. Port size, baffles, specular-exclusion or specular-inclusion geometry, sample port arrangement and detector port position matter. Record whether the measurement includes or excludes the specular component.
4. Reflectance and the reference standard
Diffuse reflectance is usually reported relative to a reference standard. Common standards include certified white materials such as barium sulfate or sintered PTFE, depending on wavelength range, instrument and application.
The reflectance is commonly expressed as:
[ R()= ]
after the instrument’s background, dark and reference corrections. Real instrument software may apply additional calibration and correction procedures.
A reference standard is not perfectly reflective at all wavelengths. Use the appropriate certified standard and follow the instrument’s measurement procedure. Keep the reference clean and avoid fingerprints, moisture, scratches and contamination.
5. Absorption and scattering in powders
A powder both absorbs and scatters light. The measured reflectance therefore depends on:
- absorption coefficient and wavelength;
- scattering coefficient and particle size distribution;
- packing density and porosity;
- sample thickness and backing;
- surface roughness and specular reflection;
- agglomeration and particle morphology;
- measurement geometry and reference standard.
This is why reflectance spectra from two powders cannot automatically be compared as if reflectance were a direct absorption coefficient. Sample preparation and optical geometry should be kept consistent.
6. Kubelka–Munk transformation
For an optically thick, diffusely scattering sample under assumptions of the Kubelka–Munk two-flux model, the remission function is commonly written:
[ F(R_)= ]
where (R_) is the diffuse reflectance of an optically thick layer relative to an ideal non-absorbing reference.
In the model, the remission function is related to the ratio of absorption and scattering coefficients:
[ F(R_)= ]
where (K) and (S) are effective absorption and scattering coefficients in the model.
Important limitations:
- The sample should be sufficiently thick that further thickness does not materially change reflectance.
- The scattering coefficient should not vary strongly across the spectral region if (F(R)) is to be interpreted as proportional to absorption.
- The idealized model assumes a diffuse, homogeneous medium; real powders may violate these assumptions.
- A Kubelka–Munk function is not an absolute absorption coefficient unless the scattering term is independently known or suitably constrained.
Do not label (F(R)) as an absorption coefficient without stating the assumptions.
7. Optical band-gap estimation and the Tauc method
The Tauc relation is often used to estimate an optical transition energy from an absorption-related quantity:
[ (h)^m = A(h-E_g) ]
where (h) is photon energy, (E_g) is the extrapolated transition energy, (A) is a proportionality constant, and the exponent (m) depends on the transition convention used.
For a common convention:
- (m=2) is often used for an allowed direct transition;
- (m=1/2) is often used for an allowed indirect transition.
The literature also uses alternative exponent conventions depending on how the Tauc equation is written. Always state the equation and exponent explicitly rather than reporting only “direct” or “indirect.”
For diffuse reflectance, authors often substitute (F(R_)) as an absorption-related proxy:
[ [F(R_)h]^m=A(h-E_g) ]
This substitution is model-dependent. It is most defensible when the sample is optically thick and scattering is approximately wavelength-independent over the fitted region.
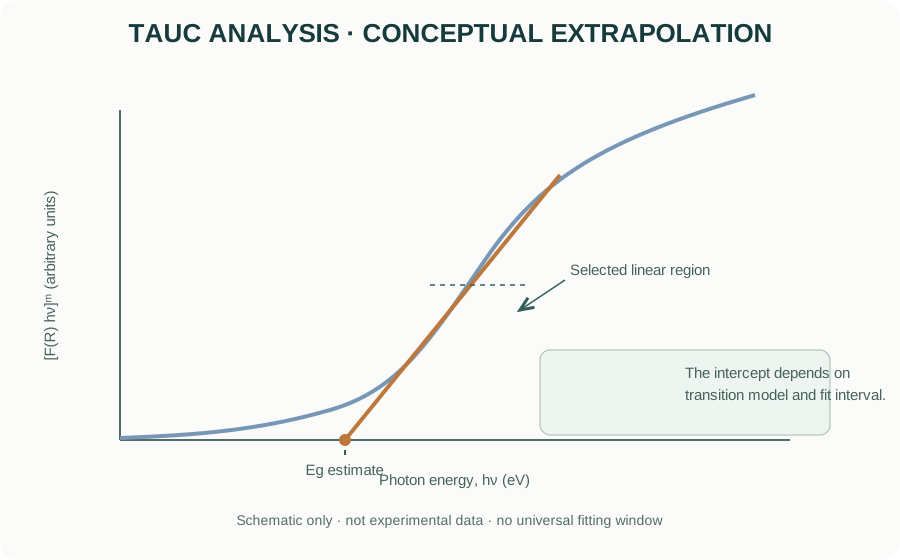
How to choose a fitting region
- Convert wavelength to photon energy using (h,[]/,[]).
- Transform reflectance only if the assumptions of the selected model are reasonable.
- Select the transition model based on physical evidence, literature context and complementary measurements—not simply whichever plot looks most linear.
- Identify a defensible linear region near the absorption edge.
- Fit that region and extrapolate to the energy axis.
- Report the fitted interval, exponent, transformation and uncertainty or sensitivity to the fitting window.
A straight line can often be produced over a chosen interval even when the underlying transition model is inappropriate. A Tauc intercept is therefore an optical-gap estimate, not proof of a unique electronic band structure.
8. Direct and indirect transitions: physical meaning
In a crystalline solid, optical transitions depend on the electronic band structure and momentum conservation. A direct transition can occur without phonon assistance when the initial and final states have compatible crystal momentum. An indirect transition generally requires a phonon to conserve momentum.
The transition type is not determined reliably from a single Tauc plot alone. Defects, Urbach tails, excitons, multiple phases, disorder, strong scattering and overlapping absorption processes can distort the apparent edge.
For complex oxides, report the method as an optical-gap estimate and discuss the assumptions. Do not claim that the material is definitively direct or indirect solely because one exponent produces a visually straighter segment.
9. Urbach tail and sub-band-gap absorption
Disorder and localized states can produce an exponential absorption edge below the main absorption region. An Urbach-type relation is often written:
[ (h)=_0() ]
where (E_U) is the Urbach energy. In diffuse reflectance analysis, an absorption-related proxy may be used with the same caution about scattering.
A larger apparent Urbach energy can be associated with stronger tailing or disorder, but it is not a unique measure of a particular defect concentration. Temperature, compositional disorder, defects and fitting interval can all affect the result.
10. Practical specimen preparation
For powder measurements:
- Use a representative, homogeneous powder and avoid contamination.
- Prepare a sufficiently thick layer to avoid contribution from the backing.
- Pack the sample consistently without creating a highly reflective smooth surface.
- Minimize large voids and strong agglomeration where practical.
- Use the same sample cup, depth and packing approach for comparative samples.
- Measure a suitable reference standard using the same optical configuration.
- Repeat measurements or reposition the sample to assess reproducibility.
For films and coatings, use a geometry appropriate to the substrate and distinguish diffuse reflectance from transmittance or specular reflectance. A powder Kubelka–Munk treatment should not be transferred automatically to a thin film.
11. Measurement workflow
Before acquisition
- Define the wavelength range and scientific question.
- Confirm lamp, detector and integrating-sphere wavelength limits.
- Select the sphere configuration and specular inclusion/exclusion condition.
- Select a reference standard suitable for the wavelength range.
- Confirm sample thickness and holder compatibility.
During acquisition
- Collect dark/background and reference signals according to the instrument procedure.
- Avoid saturating the detector or using signal levels close to its noise floor.
- Use appropriate spectral bandwidth and scan interval.
- Record scan speed, averaging, slit width and sphere configuration.
- Repeat measurements when sample packing or surface heterogeneity may affect the result.
After acquisition
- Inspect raw reflectance before transformation.
- Check for discontinuities at lamp or detector changeover wavelengths.
- Look for baseline offsets, noise, saturation and unexpected spectral features.
- Apply Kubelka–Munk only with stated assumptions.
- State the Tauc equation, exponent, fitting region and extrapolation method.
- Preserve raw reflectance data and processing steps.
12. Common artefacts and interpretation errors
| Issue | Possible effect | Control |
|---|---|---|
| Insufficient sample thickness | Substrate or backing contributes to spectrum | Verify optically thick condition |
| Inconsistent packing | Changes scattering and baseline | Standardize holder filling and compaction |
| Particle-size differences | Changes scattering and apparent edge shape | Report preparation and consider particle-size effects |
| Dirty reference | Wavelength-dependent reflectance error | Clean/replace and use certified standard |
| Specular component | Geometry-dependent reflectance | Record specular inclusion/exclusion |
| Lamp/detector crossover | Baseline discontinuity | Check instrument correction and raw spectrum |
| Strong wavelength-dependent scattering | Distorts (F(R)) interpretation | Avoid over-interpreting the transformed function |
| Defect absorption / Urbach tail | Ambiguous edge and fit interval | Compare multiple models and complementary evidence |
| Mixed phases | Multiple absorption edges | Use phase information and avoid single-edge assumptions |
13. Manufacturers and instrument resources
Official manufacturer resources:
- Agilent — UV–Vis spectroscopy
- Shimadzu — UV–Vis spectrophotometers
- JASCO — UV–Visible spectrophotometers
- PerkinElmer — UV/Vis spectroscopy
When comparing instruments, check wavelength range, spectral bandwidth, detector type, sphere diameter and coating, sample port, specular configuration, reference accessories, photometric range and software export options. A product family name does not define the configuration installed in a laboratory.
14. Reporting checklist
A reproducible UV–Vis DRS methods section should report:
- instrument manufacturer and model;
- source and detector configuration where available;
- wavelength range, spectral bandwidth and scan interval;
- integrating-sphere configuration and specular inclusion/exclusion;
- reference standard;
- sample holder, sample thickness and preparation;
- number of repeat measurements;
- reflectance processing and any baseline correction;
- Kubelka–Munk transformation and assumptions;
- Tauc exponent, transition convention and fitting interval;
- whether the reported value is an optical-gap estimate.
15. Intellectual-property and educational scope
The explanatory text and diagrams are original educational material. The optical-path, integrating-sphere and Tauc illustrations are conceptual and are not copied from manufacturer brochures or manuals. Manufacturer names and links identify their respective products. Product photographs, manuals, proprietary schematics and trademarks remain the property of their owners.
This guide explains general UV–Vis diffuse reflectance principles. It does not replace instrument-specific training, certified reference standards or the current operating manual.