Scanning Electron Microscopy (SEM) and EDS
Scanning Electron Microscopy (SEM) and Energy-Dispersive X-ray Spectroscopy (EDS)
MATERIALS CHARACTERIZATION · TOPIC 01.02 · MICROSTRUCTURE AND LOCAL ELEMENTAL ANALYSIS
SEM and EDS are commonly installed together, but they do not measure the same physical quantity.
- SEM imaging forms an image by detecting signals generated when a focused electron beam interacts with a specimen.
- EDS identifies and estimates the abundance of elements by measuring characteristic X-ray energies emitted from the specimen.
An SEM image is not automatically a chemical map, and an EDS spectrum is not a direct image of the atomic arrangement. Correct interpretation begins by identifying the signal, its interaction volume and the detector geometry.
1. What happens inside an SEM?
An electron source produces electrons. Electromagnetic lenses and apertures form and focus an electron probe. Scan coils move the probe across the specimen in a raster pattern. At each beam position, one or more detectors collect emitted signals. The measured signal is assigned to the corresponding image pixel.
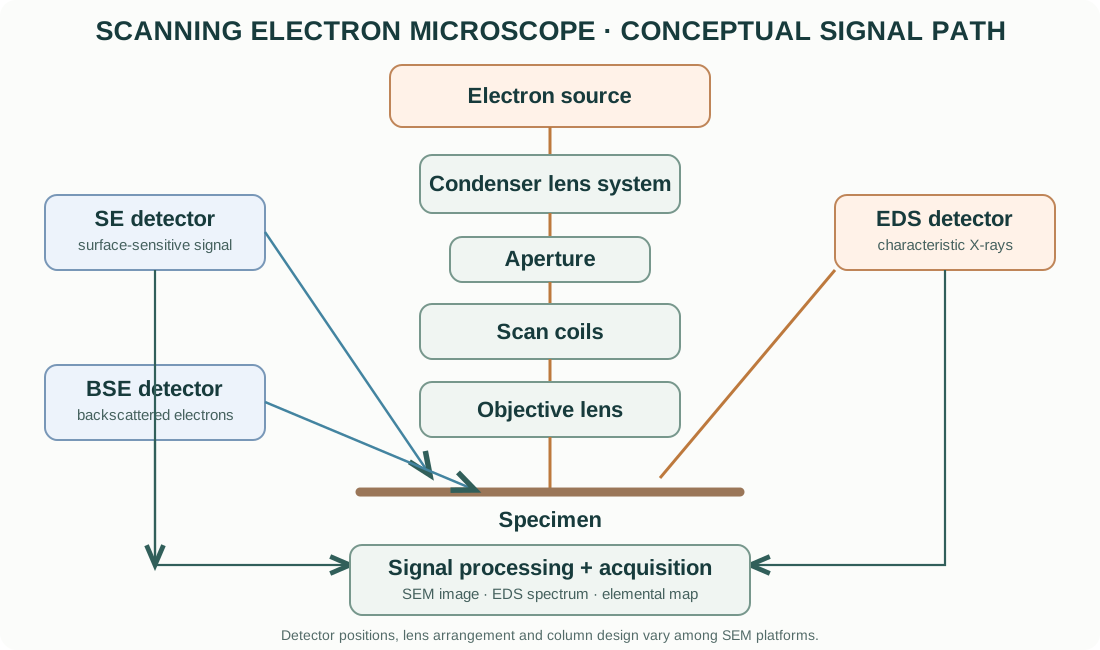
The essential sequence is:
- Generate electrons at the source.
- Accelerate them through the selected accelerating potential.
- Condense and focus the beam using electromagnetic lenses.
- Scan the beam over the specimen.
- Generate secondary electrons, backscattered electrons and, where applicable, characteristic X-rays.
- Collect the selected signal with the appropriate detector.
- Amplify, digitize and map the signal to image pixels or an EDS spectrum.
The electron source, lens design, detector arrangement, chamber and vacuum system vary by instrument. A field-emission SEM (FE-SEM) and a conventional tungsten-filament SEM should not be assumed to have identical probe characteristics.
2. Electron sources and electron optics
Electron sources
Common source types include:
- Tungsten thermionic emitter: electrons are emitted by heating a tungsten filament. It is robust and widely used, but generally has a larger source size and energy spread than high-performance field-emission sources.
- LaB₆ thermionic emitter: lanthanum hexaboride offers higher brightness and a smaller effective source than conventional tungsten in suitable systems, but requires appropriate vacuum and operating conditions.
- Schottky field-emission source: combines thermal assistance with field emission and is widely used for stable, high-brightness probes.
- Cold field-emission source: emits electrons from a very sharp tip under a strong electric field. It can provide a very small source and high brightness, with demanding vacuum and stability requirements.
Acceleration voltage
The accelerating voltage determines the incident electron energy, conventionally expressed in keV. Higher energy generally increases penetration and the interaction volume, and can excite higher-energy characteristic X-ray lines. Lower energy can improve surface sensitivity and reduce the interaction volume, but may reduce the excitation efficiency of some analytical lines and alter image contrast.
The best accelerating voltage depends on the question. It is not correct to use the highest available voltage for every sample.
Lenses, apertures and working distance
Electromagnetic lenses focus the electron beam. Condenser lenses and apertures influence probe current, convergence and spot size. The objective lens focuses the beam at the specimen.
The working distance (WD) is the distance between the objective-lens reference and the specimen region, according to the instrument’s definition. It affects focus, depth of field, detector geometry and analytical take-off angle. The optimal WD is detector- and instrument-dependent.
A smaller probe can improve spatial resolution, but probe current, beam stability, sample interaction volume, charging and signal-to-noise ratio also matter.
3. Electron–matter interactions: the origin of SEM signals
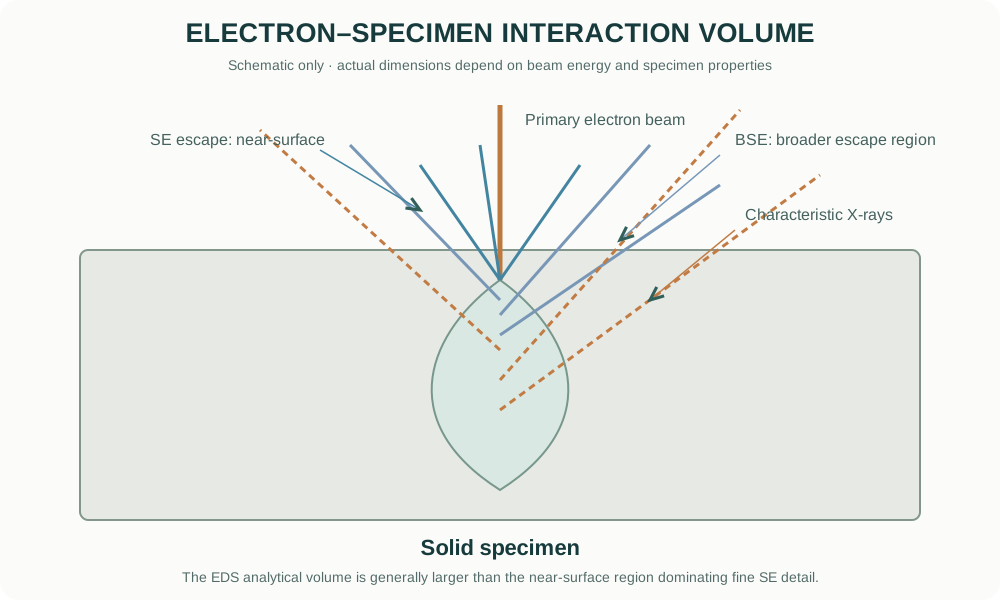
When the primary electron beam enters a solid, electrons undergo elastic and inelastic scattering. The resulting interaction volume is three-dimensional and depends on accelerating voltage, atomic number, density, specimen tilt and composition.
Secondary electrons (SE)
Secondary electrons are low-energy electrons generated mainly by inelastic interactions. Only those produced sufficiently close to the surface can escape. Their yield is strongly affected by surface topography, edges, local inclination and detector geometry.
SE images are therefore commonly used to examine surface morphology, fracture surfaces, particles and grain-boundary relief. Brightness is not a direct measure of elemental concentration.
Backscattered electrons (BSE)
Backscattered electrons are primary beam electrons that leave the specimen after elastic scattering. Their yield generally increases with average atomic number, although geometry, crystallographic orientation, surface relief and detector configuration also influence contrast.
BSE imaging can reveal compositional contrast in multiphase materials. A region containing heavier elements often appears brighter under suitable conditions, but this is a qualitative tendency, not a standalone quantitative composition measurement.
Characteristic X-rays
The incident beam can eject an inner-shell electron. An electron from a higher-energy shell then fills the vacancy, emitting an X-ray with an energy characteristic of the element and transition. EDS measures the distribution of detected X-ray photon energies to produce a spectrum.
The X-ray generation volume is often larger than the region responsible for the finest SE surface detail. Consequently, an EDS point analysis placed on a very small particle may include signal from the underlying substrate.
Other signals
Some SEMs also detect cathodoluminescence, Auger electrons, transmitted electrons or other signals using dedicated detectors and configurations. These are specialized options and should not be assumed to be available on every SEM.
4. What controls image contrast?
| Signal / mode | Dominant contrast mechanisms | Typical use |
|---|---|---|
| SE | Surface topography, edges, local inclination, detector position | Morphology, fracture, particle surfaces |
| BSE | Mean atomic number, orientation and topography | Phase/compositional contrast, inclusions |
| EDS map | Characteristic X-ray counts for selected energy windows or fitted lines | Spatial distribution of selected elements |
| STEM-in-SEM / transmitted electrons | Electron transmission and scattering through a thin specimen | Fine structure in suitable thin specimens |
Important: contrast is detector- and condition-dependent. Record the signal type, accelerating voltage, probe current, working distance, detector, tilt and other relevant conditions before comparing images.
5. SEM image formation and practical controls
An SEM image is built pixel by pixel. At each pixel, the beam interacts with the sample and the detector measures a signal over a dwell time. The instrument converts the signal into a displayed intensity.
Key acquisition parameters include:
- Accelerating voltage: affects penetration, interaction volume, resolution and excitation of analytical lines.
- Probe current: affects signal level, charging and beam damage.
- Working distance: affects focus, depth of field and detector collection geometry.
- Aperture and spot setting: influence probe current and convergence.
- Scan speed / dwell time: longer dwell can improve counting statistics but increases acquisition time and may increase drift or damage.
- Pixel size and magnification: determine sampling. High displayed magnification cannot recover detail that the probe and specimen interaction do not resolve.
- Detector and detector position: influence the contrast mechanism and shadowing.
A visually sharp image is not automatically a calibrated measurement of particle size. Calibrate the scale, inspect pixel sampling, and define a consistent segmentation method before reporting dimensions.
6. EDS: from X-ray photons to an elemental spectrum
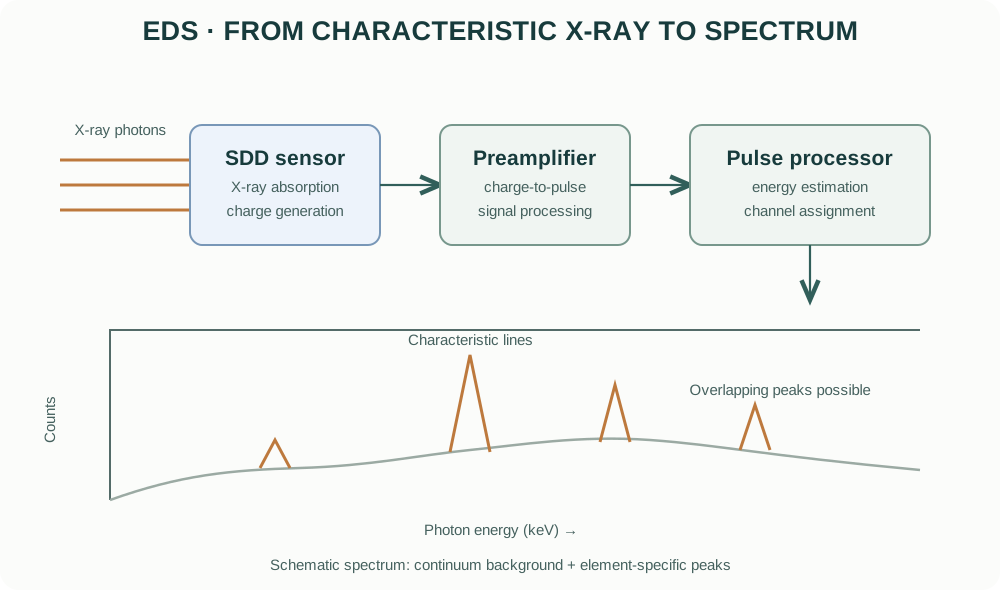
An energy-dispersive X-ray detector measures the energy deposited by incoming X-ray photons. In a typical silicon drift detector (SDD), an absorbed X-ray generates electron–hole pairs. The collected charge is proportional to photon energy and is processed by detector electronics into an energy channel.
The resulting spectrum plots X-ray counts against photon energy, usually in keV.
Characteristic peaks and line families
Each element has characteristic X-ray lines associated with electronic transitions. Common families include K, L and M lines. The accessible lines depend on the element, detector energy range, accelerating voltage and excitation threshold.
Peak identification requires care because:
- different elements can have overlapping lines;
- one element can produce several lines;
- escape peaks and sum peaks can appear as detector artefacts;
- background continuum is present;
- low-energy X-rays can be strongly absorbed by the specimen, detector window or contamination layers.
Do not assign an element from a single small peak without checking other expected lines, overlaps, background and acquisition conditions.
Qualitative versus quantitative EDS
Qualitative analysis asks which elements are consistent with the observed spectrum.
Quantitative analysis estimates concentrations after background subtraction, peak fitting and corrections for atomic number, absorption and fluorescence (commonly described as ZAF or φ(ρz)-type corrections, depending on the software and method).
Quantitative results depend on standards or standardless models, specimen flatness, homogeneity, take-off geometry, detector calibration, surface contamination and the validity of the matrix correction. Report the method and normalization basis.
EDS is generally not a reliable method for determining oxidation state or bonding environment. For chemical states, techniques such as XPS or X-ray absorption spectroscopy are more appropriate.
7. EDS point analysis, line scans and maps
- Point spectrum: collects an X-ray spectrum from a selected beam position or region. The actual analytical volume may extend below and around the visible point.
- Line scan: records selected X-ray signals along a defined path. Spatial resolution is limited by the X-ray generation volume, pixel spacing and counting statistics.
- Elemental map: records the spatial distribution of selected X-ray energies across an area. Maps can be displayed as raw counts, net counts or processed concentrations depending on software.
A coloured map is not automatically a quantitative concentration map. Check whether the map represents raw counts, background-subtracted counts, normalized intensity or calculated concentration.
Practical map acquisition
- Acquire a suitable SE or BSE image and define the region of interest.
- Choose accelerating voltage and probe current appropriate for the elements and specimen.
- Confirm that the relevant characteristic lines can be excited.
- Acquire enough counts for the required confidence while avoiding beam damage and drift.
- Inspect the full spectrum and line overlaps, not only the coloured maps.
- Compare maps with the morphology and BSE image.
- Use standards and validated quantification procedures when reporting concentrations.
8. Specimen preparation
Preparation depends on electrical conductivity, stability, roughness, porosity and the analytical question.
Conductive specimens
Conductive bulk specimens may often be mounted directly, provided they are clean, dry, stable and electrically connected to the stub where required.
Insulating ceramics and powders
Oxides, polymers and many ceramic powders can charge under the electron beam. Possible approaches include:
- applying a thin conductive coating (carbon, Au, Pt or another suitable material);
- using low-vacuum or variable-pressure operation when available;
- reducing beam current or accelerating voltage;
- improving electrical contact to the stub;
- using an appropriate low-voltage imaging mode.
Coating changes the specimen surface. Carbon coating is commonly preferred when EDS carbon analysis is not required, but it adds carbon signal and may affect surface-sensitive interpretation. Metal coatings introduce their own elemental peaks and can complicate EDS. Select the coating based on the analytical objective.
Powders
Disperse powders carefully and mount them so that representative particles are exposed. A thick powder bed can charge, move under vacuum or produce EDS contributions from multiple particles and substrate. Avoid interpreting a single attractive particle as representative of the entire batch.
Cross-sections and polished surfaces
Polished cross-sections are useful for examining phase distribution, porosity, interfaces and compositional gradients. Preparation artefacts such as pull-out, smearing, relief and contamination can mimic real microstructural features.
9. Charging, contamination and beam damage
| Problem | Observable symptom | Possible mitigation |
|---|---|---|
| Charging | Image drift, bright patches, streaks, unstable contrast | Improve grounding, coat, reduce current/voltage, use low vacuum |
| Hydrocarbon contamination | Deposits or progressive image changes under the beam | Clean specimen/chamber appropriately; minimize unnecessary dwell |
| Beam damage | Shrinkage, melting, decomposition, changing morphology | Lower dose, reduce current, scan rapidly, use cryogenic or specialized methods if justified |
| Drift | Blurred or displaced features during long scans | Stabilize specimen, reduce scan time, allow thermal equilibration |
| Poor grounding | Unstable signal and charging | Verify conductive path from specimen to stub |
| Surface contamination | Unexpected C, O or other signals | Use clean handling and appropriate surface preparation |
Vacuum level and coating methods must follow the instrument’s approved procedures. Never bypass interlocks or introduce volatile, wet or hazardous specimens without the required preparation and authorization.
10. Spatial resolution: why an EDS spot is not a mathematical point
The electron probe has a finite diameter, but the analytical volume is also determined by electron scattering and X-ray generation. At higher accelerating voltages, the interaction volume generally becomes larger. Higher-density and higher-atomic-number materials tend to have different interaction volumes from low-density materials.
The practical consequence is important for functional ceramics and nanocomposites:
- a small particle on a substrate may yield a spectrum containing both particle and substrate;
- a thin grain-boundary phase may be diluted by surrounding material;
- a map pixel can be much smaller than the true chemical resolution;
- the nominal beam diameter is not the same as EDS spatial resolution.
Use Monte Carlo simulations or validated interaction-volume estimates when spatial resolution is central to the conclusion. Report the beam conditions and specimen geometry.
11. Common EDS interpretation errors
- Treating all detected elements as constituents of the target particle. The substrate, mounting medium, coating and chamber contamination can contribute.
- Interpreting oxygen quantification as highly accurate by default. Light-element quantification is sensitive to absorption, surface condition and detector response.
- Ignoring peak overlaps. Confirm assignments using all relevant line families and fit residuals.
- Reporting atomic percent without saying so. Distinguish atomic percent (at.%) from weight percent (wt.%) and state normalization.
- Treating a map colour scale as concentration. Establish whether the map is counts, net counts or quantified composition.
- Using EDS to claim oxidation state. EDS identifies elements, not reliable valence states.
- Comparing spectra acquired under different conditions as if directly equivalent. Beam energy, current, geometry, dwell, detector and processing all affect intensity.
12. Practical workflow for a ceramic powder or sintered oxide
- Define whether the objective is morphology, grain size, porosity, phase contrast or elemental distribution.
- Select representative powder or a properly prepared polished cross-section.
- Choose mounting and coating compatible with the EDS question.
- Begin with a moderate beam condition and inspect for charging or damage.
- Acquire SE images for surface morphology and BSE images for potential compositional contrast.
- Collect EDS spectra from multiple representative regions, not only one point.
- Check line overlaps, background, substrate and coating contributions.
- Acquire maps only after selecting suitable lines and sufficient count statistics.
- Compare the EDS results with XRD, XPS or other independent methods as appropriate.
- Archive raw images, spectra, quantification settings and acquisition metadata.
13. SEM/EDS manufacturers and instrument families
The following manufacturer resources are official product or technology pages. Configurations and detector options vary by model and installed accessories.
- Thermo Fisher Scientific — Electron Microscopy
- ZEISS — Scanning Electron Microscopes
- JEOL — Scanning Electron Microscopes
- Hitachi High-Tech — Scanning Electron Microscopes
- Oxford Instruments — EDS and microanalysis
- Bruker — Energy Dispersive X-ray Spectrometry
When comparing systems, examine source type, achievable probe current and energy, detector types, chamber modes, stage geometry, EDS detector area, energy resolution, take-off angle and software capabilities. The product family name alone does not define the performance of a particular installed system.
14. What to report in a publication
For SEM imaging, report the instrument manufacturer and model, electron source where relevant, accelerating voltage, working distance, detector/signal type, probe current or spot setting where available, coating and specimen preparation.
For EDS, additionally report detector type, accelerating voltage, acquisition time or counts, analysed region, selected X-ray lines, standards or standardless method, matrix correction, quantification basis (wt.% or at.%) and relevant limitations.
15. Intellectual-property and educational scope
The explanatory text and figures in this guide are original educational material. The diagrams are conceptual illustrations and are not copied from manufacturer manuals or product brochures. Manufacturer names and links identify their respective products. Product photographs, manuals, proprietary schematics and trademarks remain the property of their respective owners.
This guide explains general SEM/EDS principles. It does not replace instrument-specific training, vacuum and high-voltage safety procedures, radiation-safety requirements or the current operating manual.