SEM and EDS: A Practical Guide to Microstructure and Elemental Analysis
SEM and EDS: A Practical Guide to Microstructure and Elemental Analysis
Scanning electron microscopy (SEM) and energy-dispersive X-ray spectroscopy (EDS, also called EDX) are frequently used together to examine ceramic materials. SEM reveals surface and microstructural contrast; EDS provides spatially resolved information about elemental composition. The two methods are complementary, but neither should be interpreted beyond its physical and analytical limits.
1. What SEM measures
In SEM, a focused electron beam is scanned across the specimen. Interactions between the incident electrons and the sample generate several signals, including secondary electrons, backscattered electrons and characteristic X-rays.
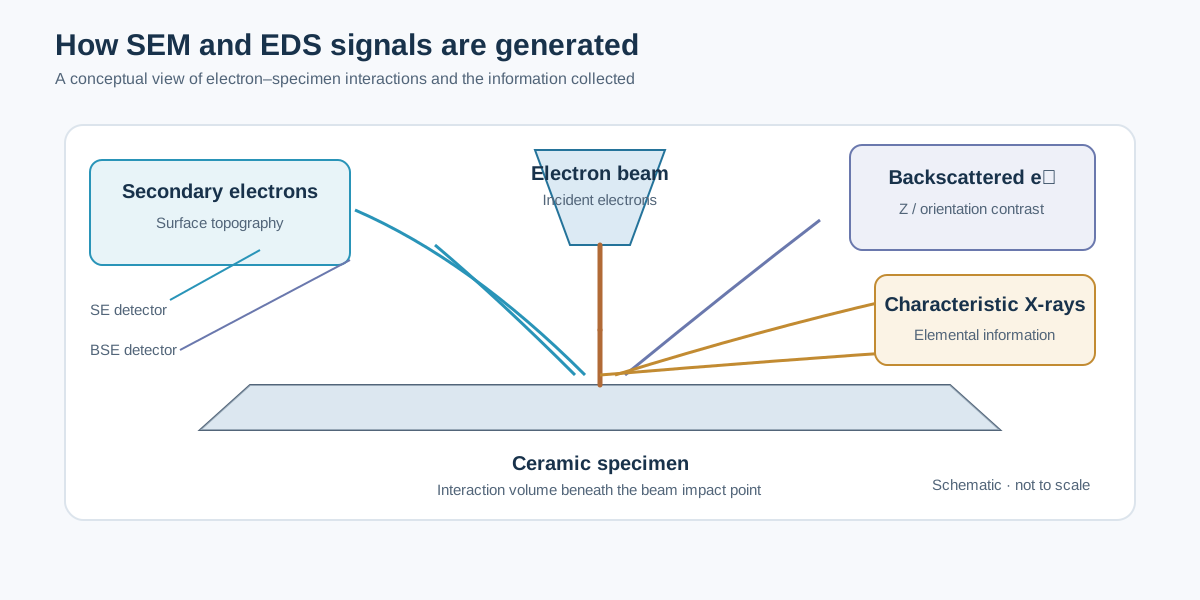
Secondary electrons (SE)
Secondary electrons are low-energy electrons generated near the specimen surface. Their yield is strongly influenced by surface inclination and local topography, making SE images useful for examining:
- Grain morphology and grain-boundary relief.
- Pores, cracks and fracture surfaces.
- Surface coatings and particle agglomeration.
- Fine surface features, within the resolution and working-distance limits of the instrument.
SE contrast is not a direct map of composition. A bright edge or grain can result from topography and detector geometry rather than a higher concentration of a particular element.
Backscattered electrons (BSE)
Backscattered electrons are incident electrons that leave the specimen after elastic scattering. Their yield generally increases with average atomic number, so BSE images often provide useful compositional contrast.
In a polished multiphase ceramic, regions containing heavier elements may appear brighter than regions containing lighter elements. However, brightness can also be affected by crystallographic orientation, surface relief, detector arrangement and charging. Use EDS or another independent method to test a compositional interpretation.
2. Interaction volume and spatial resolution
The electron beam does not generate all signals at a single point. Incident electrons undergo scattering and produce an interaction volume extending beneath and around the beam impact point. Characteristic X-rays may originate from a region much larger than the nominal electron-beam diameter.
The interaction volume becomes larger as accelerating voltage increases and generally smaller in denser or higher-average-atomic-number materials at a given voltage. Consequently:
- A small particle on a bulk substrate may produce a mixed particle–substrate spectrum.
- A narrow grain boundary may not be spatially resolved by EDS at conventional beam conditions.
- A polished cross-section is usually more suitable than a rough surface for quantitative point analysis.
- Lower beam voltage can improve spatial localization, but may prevent reliable excitation of higher-energy characteristic lines.
The effective EDS resolution is therefore not simply the pixel size of an elemental map. It is governed by X-ray generation and specimen interaction physics.
3. Preparing ceramic specimens
Preparation should be selected according to the question being asked.
Bulk polished sections
For grain-size analysis, porosity assessment and compositional comparison between phases:
- Mount the specimen if necessary.
- Grind and polish progressively to obtain a flat, scratch-minimized surface.
- Clean thoroughly to remove polishing residues.
- Dry the specimen and avoid contamination during handling.
- Apply a conductive coating only if required by the instrument and specimen conductivity.
A polished cross-section is generally preferable for quantitative EDS because it reduces topographic effects and makes interaction geometry more reproducible.
Fracture surfaces and powders
Fracture surfaces can reveal intergranular versus transgranular fracture and expose internal microstructure, but their relief complicates quantitative EDS. Powder specimens should be mounted so that particles are stable and representative; loose particles can move under vacuum or the electron beam.
Conductive coating
Non-conductive oxides may charge under the electron beam. A thin conductive coating can reduce charging, but the coating material must be considered during EDS interpretation. Carbon coating is often used when carbon is not a target analyte; metal coatings can introduce additional peaks or interfere with analysis. Coating thickness and uniformity matter.
If carbon content is important, do not assume a carbon-coated specimen can provide an uncontaminated carbon measurement. Select preparation and coating conditions accordingly.
4. Choosing accelerating voltage and working distance
There is no universal SEM voltage suitable for every ceramic.
- Accelerating voltage: choose a voltage that provides the required signal and X-ray overvoltage for the elements of interest, while controlling interaction-volume size and beam damage.
- Working distance: use the range recommended for the detector and imaging mode. A shorter working distance may improve resolution in some configurations, but can reduce detector geometry options.
- Probe current: higher current can improve X-ray count rate but may increase charging, contamination, heating or beam damage.
- Dwell time: longer dwell improves counting statistics but increases acquisition time and the risk of drift or damage.
For EDS, the selected voltage must be sufficient to excite the chosen characteristic shell. A practical overvoltage ratio is
[ U= ]
where (E_0) is the incident electron energy and (E_c) is the critical ionization energy for the shell. The appropriate value depends on the analytical line and the desired balance between excitation efficiency and spatial resolution. Do not choose voltage from a fixed rule without checking the elements and lines being measured.
5. What EDS detects
When an incident electron removes an inner-shell electron, an electron from a higher-energy shell can fill the vacancy. The energy difference may be emitted as a characteristic X-ray. Because each element has characteristic X-ray energies, an EDS detector can identify many elements from the measured spectrum.
A spectrum typically contains:
- Characteristic peaks from elements in the interaction volume.
- Bremsstrahlung (continuum) background.
- Possible escape peaks, sum peaks or detector-related artefacts.
- Overlapping characteristic lines from different elements.
Element identification requires checking peak energies, possible overlaps and the expected chemistry. Automated peak labels are a starting point, not a final interpretation.
Peak overlap and line selection
Some elemental lines are close in energy. Peak overlap can make identification or quantification ambiguous, especially when one element is present at low concentration and another has a strong nearby line. Use alternative lines, higher-resolution wavelength-dispersive spectroscopy (WDS), standards or complementary methods when the overlap materially affects the conclusion.
Light elements such as B, C, N and O can be more difficult to quantify reliably than many heavier elements. Detector window design, surface contamination, absorption, coating and specimen geometry all influence low-energy X-ray measurements.
6. EDS point analysis, area analysis and mapping
Point analysis
A point spectrum is useful for checking the composition of a selected grain or phase. Before interpreting it as the composition of that phase, verify that the interaction volume is not substantially sampling adjacent grains, pores, mounting resin or the substrate.
Area analysis
An area spectrum averages signals over the selected region. It can be more representative than a single point when the microstructure is heterogeneous, but the result depends on the selected area and phase proportions.
Elemental maps
EDS maps display the spatial distribution of selected X-ray signals. They are useful for identifying segregation, inclusions, reaction layers and compositional gradients.
Map brightness is affected by counts, acquisition time, background subtraction, display scaling and processing. For comparisons between samples, keep acquisition and processing conditions consistent. A visually bright map does not automatically mean a higher concentration unless the data have been appropriately quantified and normalized.
7. From counts to composition
Quantitative EDS is more complex than reading peak heights. The measured intensity depends on the number of atoms, ionization cross-sections, X-ray absorption, fluorescence, detector response and specimen geometry.
A simplified expression for the intensity ratio is
[ k_i= ]
where the sample and standard intensities are measured under suitably comparable conditions. Matrix corrections are then applied to account for differences between sample and standard. Common correction approaches include ZAF (atomic number, absorption and fluorescence) and ((z))-based methods.
Standardless quantification estimates composition using instrument models and reference data rather than measurements from suitable standards. It is convenient for screening, but its uncertainty can be substantial, particularly for rough surfaces, low-energy lines, light elements, minor constituents and complex multiphase specimens.
Weight percent and atomic percent
EDS software commonly reports both weight percent and atomic percent. They answer different questions:
- Weight percent (wt.%): fraction of total elemental mass.
- Atomic percent (at.%): fraction of total number of atoms.
For a compound containing elements with different atomic masses, these values can differ substantially. Always state which basis is being reported. Normalization to 100% does not establish that every element has been detected or that the assumed elements are correct.
8. Practical workflow for oxide ceramics
A defensible SEM–EDS workflow for a sintered oxide is:
- Define the question. Grain size, pore distribution, phase segregation and elemental homogeneity require different preparation and acquisition choices.
- Prepare the surface. Use a polished cross-section for quantitative comparison; document coating and mounting materials.
- Survey at low magnification. Identify representative regions, pores, cracks and obvious heterogeneity.
- Acquire SE and BSE images. Use SE for topography and BSE for potential compositional contrast; do not conflate the two.
- Select analytical conditions. Choose voltage, current, working distance and detector geometry based on the elements and spatial scale.
- Collect spectra from multiple regions. Include representative grains, grain boundaries and secondary phases where relevant.
- Acquire maps with adequate counts. Record live time, pixel size, process time and map conditions.
- Check quantification. Inspect peak fits, overlaps, standards or correction method, normalization and uncertainties.
- Cross-check the interpretation. Compare with XRD, synthesis chemistry, ICP-OES/ICP-MS or other suitable methods.
9. Common interpretation errors
- “A bright BSE region is definitely a new phase.” Brightness suggests contrast, not phase identity. Confirm with chemistry and diffraction where possible.
- “An EDS map proves atomic-scale homogeneity.” Map resolution is limited by the X-ray generation volume, counts and acquisition conditions.
- “Oxygen wt.% gives exact oxygen stoichiometry.” Oxygen quantification can be sensitive to absorption, surface condition and matrix corrections. Use charge balance and complementary analysis carefully.
- “The software reports 100%, so the analysis is accurate.” Normalization is mathematical; it does not validate peak identification or matrix corrections.
- “A point spectrum is the composition of one grain.” The interaction volume may include neighboring grains, pores, coating or mounting medium.
- “No carbon peak means no carbon contamination.” Detection limits, coating and acquisition conditions matter.
10. What to report in a paper
For reproducibility, report the SEM model, detector type, accelerating voltage, working distance, probe current or relevant beam setting, imaging mode, specimen preparation and coating. For EDS, also report the detector, selected X-ray lines where relevant, live time or map acquisition conditions, quantification method, standards or standardless approach, and whether results are wt.% or at.%.
Representative images should include scale bars and clearly identify the analyzed regions. For quantitative claims, provide replicate measurements or spatial statistics rather than relying on one selected spectrum.
Further reading
- J. I. Goldstein et al., Scanning Electron Microscopy and X-Ray Microanalysis, 4th ed., Springer (2018).
- D. E. Newbury and N. W. M. Ritchie, “Is scanning electron microscopy/energy dispersive X-ray spectrometry (SEM/EDS) quantitative?”, Scanning 35 (2013), 141–168. https://doi.org/10.1002/sca.21041
- ASTM E1508, Standard Guide for Quantitative Analysis by Energy-Dispersive Spectroscopy.