Porosity and Pore Structure Control in Sol-Gel Materials
Porosity and Pore Structure Control in Sol-Gel Materials
Porosity is not a single material property. Two samples can have the same total pore volume but very different pore-size distributions, accessible surface areas, connectivity and transport behaviour. In sol-gel processing, these features develop across several stages: solution chemistry, gelation, ageing, drying and thermal conversion.
The purpose of this article is to distinguish the quantities used to describe a porous solid, explain the main characterization methods and establish a process-based approach to pore-structure design. No single processing condition produces a universally desirable pore network; the target depends on the intended application and the chemistry of the precursor system.
1. What does porosity describe?
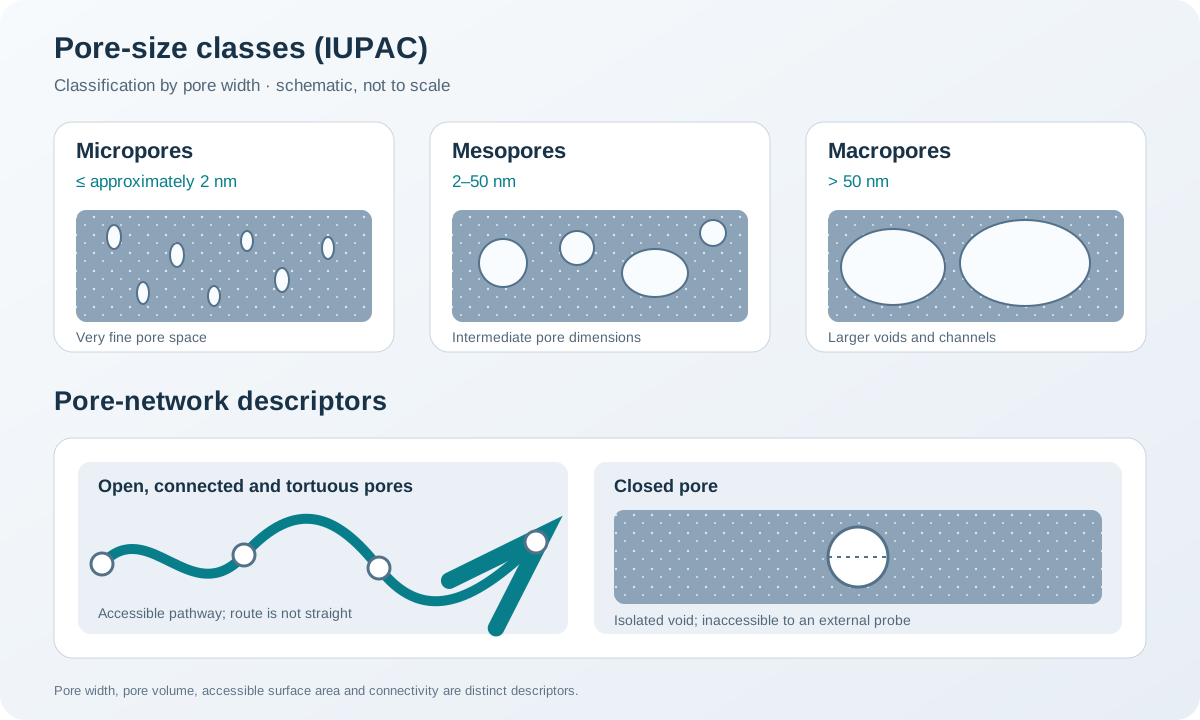
A porous solid contains void space within or between its structural elements. The voids may be connected to the external surface, isolated, or connected through openings that are narrower than the cavities they lead to.
The following quantities describe different aspects of this structure:
| Quantity | Meaning | Common reporting basis |
|---|---|---|
| Pore size or width | Characteristic dimension of a pore | nm or µm; state the pore model |
| Pore volume | Volume occupied by pores accessible to the measurement method | cm³ g⁻¹ |
| Specific surface area | Surface area accessible to a specified probe, per unit mass | m² g⁻¹ |
| Porosity | Fraction of bulk volume occupied by voids | % |
| Connectivity | Whether pores form continuous pathways through the solid | Structural or transport descriptor |
| Open porosity | Pores connected to the external surface | % or volume fraction |
| Closed porosity | Isolated voids not accessible from the external surface | % or volume fraction |
| Tortuosity | Measure of how indirect a transport pathway is relative to a straight path | Dimensionless; definition depends on method |
These quantities are related but not interchangeable. A high BET surface area does not by itself prove high total porosity, high permeability or good pore connectivity. Likewise, a large pore volume does not necessarily imply a large surface area.
Pore size must also be reported with its measurement model. A cylindrical-pore diameter, a slit-pore width and a pore-body diameter in an ink-bottle network are not necessarily equivalent descriptions.
2. IUPAC pore-size classification
The widely used IUPAC classification divides pores according to their width:
- Micropores: widths not exceeding approximately 2 nm.
- Mesopores: widths from approximately 2 to 50 nm.
- Macropores: widths greater than approximately 50 nm.
These boundaries are conventional and were developed in the context of gas adsorption. They remain useful for describing porous materials, but the classification does not specify pore shape, connectivity or accessibility.
The term nanoporous is often used for materials containing pores in the nanometre range; its precise upper limit should be stated when the term is used quantitatively.
3. How pore structure develops during sol-gel processing
Pore architecture is established progressively rather than at one isolated processing step.
3.1 Precursor chemistry and solution structure
Precursor concentration, solvent composition, hydrolysis and condensation rates, complexation and catalyst concentration influence the size and connectivity of the growing inorganic clusters. These factors can affect the distance between network elements and the amount and distribution of liquid retained in the gel.
A rapid increase in network connectivity may produce a different structure from a slowly evolving sol, even when the nominal final composition is identical. Local phase separation can also generate larger voids or compositionally distinct regions.
3.2 Gelation and ageing
At gelation, a continuous network spans the sample and traps a liquid phase. During ageing, further condensation, dissolution–reprecipitation and structural rearrangement can strengthen the network and change its pore dimensions.
Ageing may improve resistance to capillary stress during drying, but it can also reduce pore volume or alter pore-size distribution. The direction and magnitude of these changes depend on the chemistry and solvent environment.
3.3 Drying
During evaporation, curved liquid menisci generate capillary pressure. For an ideal cylindrical meniscus, the magnitude can be approximated by the Young–Laplace relation:
[ P = ]
where (_{LV}) is the liquid-vapour surface tension, () is the contact angle and (r) is the meniscus radius. The equation illustrates why small liquid-filled pores can experience substantial capillary stress.
If the wet network cannot withstand this stress, it may shrink, crack or collapse. Solvent exchange, controlled evaporation, surface modification and supercritical drying are among the strategies used to modify drying stress. Their suitability depends on process safety, equipment and the chemical stability of the network.
3.4 Thermal conversion
Heating can remove solvent and organic residues, decompose precursor-derived species, crystallize the inorganic framework and promote neck growth or sintering. These processes may narrow or eliminate pores, merge neighbouring voids, or create new voids as volatile species leave.
A pore-size distribution measured after drying should therefore not be assumed to represent the final heat-treated material. Characterize the material at the process stage relevant to its intended use.
4. Processing variables and their possible effects
| Processing variable | Structural effects to investigate |
|---|---|
| Precursor concentration | Cluster separation, gel density, shrinkage and pore volume |
| Water content and addition rate | Hydrolysis/condensation kinetics and network uniformity |
| pH and catalyst | Reaction rates, aggregation and gelation pathway |
| Solvent identity and composition | Solvation, phase compatibility, surface tension and drying stress |
| Complexing or stabilizing agents | Precursor reactivity and homogeneity; residual organics after conversion |
| Ageing time and temperature | Network strengthening, condensation and syneresis |
| Template or surfactant | Formation of a targeted mesostructure, subject to template removal |
| Drying route | Shrinkage, cracking, pore collapse and retained pore volume |
| Heating rate and maximum temperature | Organic removal, crystallization, grain growth and sintering |
| Atmosphere | Decomposition chemistry, oxidation state and defect formation |
These are interacting variables, not independent controls. For example, changing solvent composition can alter both gelation and drying. A template can generate an ordered pore arrangement, but incomplete removal may block pores or leave residues. Thermal treatment may improve crystallinity while simultaneously reducing accessible surface area.
A defensible optimization study should change a limited number of variables at a time and characterize the resulting structure rather than infer it from the recipe.
5. Gas physisorption: the central method for accessible surface and pore analysis
Gas physisorption measures the amount of gas adsorbed by a solid as a function of relative pressure, usually reported as (p/p_0). Nitrogen adsorption at 77 K is widely used for surface-area and mesopore analysis. Argon adsorption at 87 K can be advantageous for some microporous materials because it avoids the quadrupole-related interactions associated with nitrogen.
The result describes pores accessible to the selected adsorptive under the measurement conditions. It does not automatically include closed pores or pores that the probe cannot enter.
5.1 Adsorption isotherms and hysteresis
An adsorption isotherm plots the amount adsorbed against relative pressure. IUPAC classifies common physisorption isotherms into Types I–VI. The shape provides information about the adsorption mechanism and pore structure, but it should not be used as a stand-alone pore-shape identification.
For mesoporous solids, adsorption and desorption branches may differ, producing a hysteresis loop associated with capillary condensation and evaporation. The IUPAC H1–H5 loop categories describe characteristic patterns:
- H1: often associated with a relatively narrow distribution of uniform mesopores, although some pore networks can produce similar loops.
- H2: associated with more complex pore networks where pore blocking, percolation or cavitation may be important.
- H3: commonly observed for non-rigid aggregates of plate-like particles or networks containing incompletely filled macropores.
- H4: often associated with narrow slit-like pores and materials containing both micropores and mesopores.
- H5: associated with certain structures containing open and partially blocked mesopores.
These associations are indicative, not unique structural proofs. Network effects and the selected adsorptive can change the observed loop. In particular, a desorption-branch feature should not automatically be interpreted as the true pore-body size when pore blocking or cavitation is possible.
5.2 BET specific surface area
The Brunauer–Emmett–Teller (BET) method estimates the monolayer capacity from an appropriate region of the adsorption isotherm. The monolayer capacity is then converted to an area using the assumed molecular cross-sectional area of the adsorptive.
The BET method is widely used, but its application requires care:
- Select the pressure range using consistency criteria rather than choosing a fixed range automatically.
- Check that the BET constant and calculated monolayer pressure are physically consistent.
- Report the adsorptive, measurement temperature, sample pretreatment and fitting range.
- In microporous materials, BET area may be an apparent or comparative fingerprint rather than a literal geometrical surface area.
- Different degassing conditions can change the material itself, particularly if it contains hydroxyl groups, volatile species or a fragile network.
The BET area is therefore a model-derived, probe-accessible surface area, not a direct measurement of every internal surface.
5.3 BJH pore-size analysis
The Barrett–Joyner–Halenda (BJH) method estimates mesopore-size distributions using the Kelvin equation together with a model for the adsorbed layer. It is commonly applied to the adsorption or desorption branch of a nitrogen isotherm.
BJH is useful as a conventional comparison method, but it has important limitations:
- The Kelvin-equation treatment becomes unreliable for small mesopores where molecular-scale effects are significant.
- The result depends on the assumed pore geometry and branch used.
- Desorption analysis can be distorted by pore blocking and cavitation.
- A single BJH curve does not uniquely reconstruct a complex three-dimensional pore network.
For materials with narrow mesopores or microporosity, methods based on density functional theory (DFT), including NLDFT or QSDFT kernels, are often more appropriate. The selected kernel should match the adsorptive, temperature, surface chemistry and assumed pore geometry. Report the model and kernel rather than presenting a pore-size distribution without its analysis basis.
6. Complementary methods: no single technique measures everything
| Method | Main information | Important limitations |
|---|---|---|
| Nitrogen physisorption at 77 K | BET area, accessible micro/mesopore information and adsorption hysteresis | Probe accessibility; equilibration and model dependence |
| Argon physisorption | Useful micropore analysis in suitable systems | Requires appropriate temperature and analysis model |
| Mercury intrusion porosimetry | Access-throat sizes over a broad pressure-dependent range | Destructive or intrusive; assumes a contact angle and pore geometry; high pressure can damage fragile structures |
| SAXS | Statistical nanoscale electron-density contrast and characteristic length scales | Model-dependent; does not directly provide a unique pore network |
| SEM | Larger pores, cracks, particle packing and morphology | Limited resolution for the smallest pores; surface preparation can introduce artefacts |
| TEM | Local nanoscale pore and framework structure | Small sampled volume; specimen preparation and projection effects |
| Gas or liquid pycnometry | Skeletal or envelope-density information depending on method | Interpretation depends on which pores the fluid can access |
| Bulk and skeletal density comparison | Estimate of total porosity under stated assumptions | Requires reliable density values and consistent definitions |
Mercury intrusion uses high pressure to force a non-wetting liquid into accessible pore entrances. It can be useful for larger pores and pore throats, but the pressure may compress or fracture a weak gel-derived body. Mercury is also highly toxic and requires dedicated equipment, containment and hazardous-waste procedures; it is not a routine substitute for gas adsorption.
Density-derived porosity is often estimated as:
[ P = 1- ]
where (P) is the porosity fraction, ({bulk}) is the bulk density and ({skeletal}) is the skeletal density measured using a specified method. The equation is meaningful only when the density definitions and pore accessibility are compatible. State whether the result includes closed pores and how the skeletal density was obtained.
7. Sample preparation and data-quality controls
A physisorption result is only as reliable as the sample preparation and analysis.
- Choose a representative sample. Avoid selecting only a visibly unusual fragment or a small region that may not represent the bulk.
- Record the sample history. Include drying, ageing, heat treatment, storage and exposure to humidity.
- Select degassing conditions carefully. Temperature, duration and vacuum should remove adsorbed contaminants without changing the pore structure or surface chemistry.
- Check for mass stability. Uncontrolled mass loss during pretreatment can make the reported area and pore volume misleading.
- Use a suitable analysis model. BET, BJH and DFT answer different questions; they are not interchangeable.
- Inspect the raw isotherm. Check equilibration, hysteresis, pressure range and any unusual discontinuities before interpreting derived values.
- Report the full method. Include adsorptive, temperature, pretreatment, instrument, analysis branch, model/kernel and fitting criteria.
Degassing is not a neutral step for every material. If the framework dehydroxylates, decomposes, restructures or loses residual species during pretreatment, the measured structure may no longer represent the original sample.
8. Designing a pore structure for a target function
Pore design should begin with the transport or interfacial requirement rather than with a target BET value alone.
- High accessible surface area: prioritize accessible fine pores and avoid pore blocking, while checking that the framework remains stable.
- Rapid mass transport: consider connected larger pores or hierarchical structures that reduce diffusion resistance.
- Mechanical integrity: avoid excessive void fraction or fragile thin walls; evaluate shrinkage and strength after final thermal treatment.
- Controlled infiltration: match pore entrances and connectivity to the size and wetting behaviour of the species that must enter.
- Thermal stability: assess whether the pore walls coarsen, densify or collapse at operating temperature.
- Reproducibility: control solution ageing, humidity, drying geometry and thermal history.
Hierarchical porosity combines more than one pore-size regime. For example, larger transport channels can connect to smaller surface-rich pores. However, a hierarchical appearance in microscopy does not prove that all pore populations are connected or accessible to the working fluid.
9. A practical pore-structure optimization workflow
- Define the required function: surface reaction, adsorption, diffusion, filtration, insulation or another application-specific target.
- Specify the relevant pore-size range and whether pore bodies, entrances or connected pathways are most important.
- Prepare a baseline gel using a fully documented solution and ageing history.
- Change one processing factor at a time, or use a designed experiment when interactions are expected.
- Characterize dried and final heat-treated samples separately.
- Combine gas adsorption with microscopy, scattering or density measurements as appropriate.
- Compare pore volume, surface area, pore-size distribution, shrinkage and mechanical integrity together.
- Repeat the selected condition to establish batch-to-batch reproducibility.
The output should be a structure–processing relationship supported by measurements, not simply a recipe associated with a single BET number.
10. Common interpretation errors
| Error | Why it is problematic | Better practice |
|---|---|---|
| Treating BET area as total internal area | BET measures probe-accessible area under a model | State it as BET specific surface area and report pretreatment |
| Treating BJH output as an exact pore map | BJH assumes simplified pore geometry and Kelvin-based behaviour | State model and branch; consider DFT-based analysis |
| Equating pore volume with porosity | One is a volume per mass; the other is a fraction of bulk volume | Convert only with compatible density definitions |
| Inferring connectivity from a hysteresis loop alone | Similar loops can arise from different network structures | Combine adsorption with imaging or transport measurements |
| Comparing samples with different degassing protocols | Pretreatment may change accessible area or the material itself | Use and report a validated common protocol |
| Assuming the dried-gel structure survives calcination | Thermal conversion can cause shrinkage, coarsening and pore collapse | Measure the final processed state |
| Calling every visible dark region a pore | Imaging contrast and preparation artefacts can be misleading | Use complementary methods and appropriate controls |
References
- M. Thommes, K. Kaneko, A. V. Neimark, J. P. Olivier, F. Rodríguez-Reinoso, J. Rouquerol and K. S. W. Sing, “Physisorption of gases, with special reference to the evaluation of surface area and pore size distribution (IUPAC Technical Report),” Pure and Applied Chemistry 87 (2015), 1051–1069. https://doi.org/10.1515/pac-2014-1117.
- J. Rouquerol, P. Llewellyn and F. Rouquerol, “Is the BET equation applicable to microporous adsorbents?” Studies in Surface Science and Catalysis 160 (2007), 49–56. https://doi.org/10.1016/S0167-2991(07)80008-5.
- J. C. Groen, L. A. A. Peffer and J. Pérez-Ramírez, “Pore size determination in modified micro- and mesoporous materials. Pitfalls and limitations in gas adsorption data analysis,” Microporous and Mesoporous Materials 60 (2003), 1–17. https://doi.org/10.1016/S1387-1811(03)00339-1.
- A. E. Danks, S. R. Hall and Z. Schnepp, “The evolution of ‘sol–gel’ chemistry as a technique for materials synthesis,” Materials Horizons 3 (2016), 91–112. https://doi.org/10.1039/C5MH00260E.
- C. J. Brinker and G. W. Scherer, Sol-Gel Science: The Physics and Chemistry of Sol-Gel Processing, Academic Press (1990).
Scope note: Pore dimensions and surface areas are method-dependent quantities. Always report the probe, pretreatment, analysis model and sample state, and avoid treating a derived pore-size distribution as a direct image of the complete three-dimensional pore network.